Grafana-Plugin
Grafana is an open source volume metrics monitoring and visualization tool, which can be used to present time series data and analyze application runtime status.
We developed the Grafana-Plugin for IoTDB, using the IoTDB REST service to present time series data and providing many visualization methods for time series data.
Compared with previous IoTDB-Grafana-Connector, current Grafana-Plugin performs more efficiently and supports more query types. So, we recommend using Grafana-Plugin instead of IoTDB-Grafana-Connector.
Installation and deployment
Install Grafana
- Download url: https://grafana.com/grafana/download
- Version >= 7.0.0
Install Grafana-Plugin
- Plugin name: grafana-plugin
- Download url: https://github.com/apache/iotdb.git
Execute the following command:
git clone https://github.com/apache/iotdb.gitCompile Grafana-Plugin
Compile Method 1
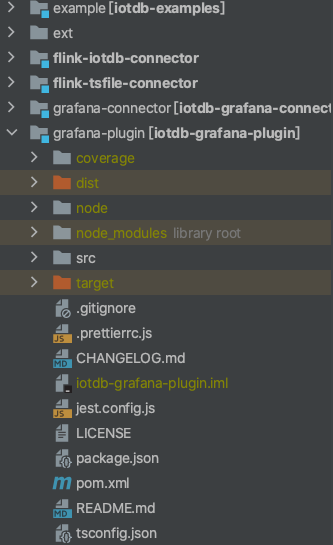
We need to compile the front-end project in the IoTDB grafana-plugin directory and then generate the dist directory. The specific execution process is as follows.
- Option 1 (compile with maven): execute following command in the
grafana-plugindirectory:
mvn install package -P compile-grafana-plugin- Option 2 (compile with yarn): execute following command in the
grafana-plugindirectory:
yarn install
yarn build
If compiling successful, you can see the dist directory , which contains the compiled Grafana-Plugin:
Compile Method 2
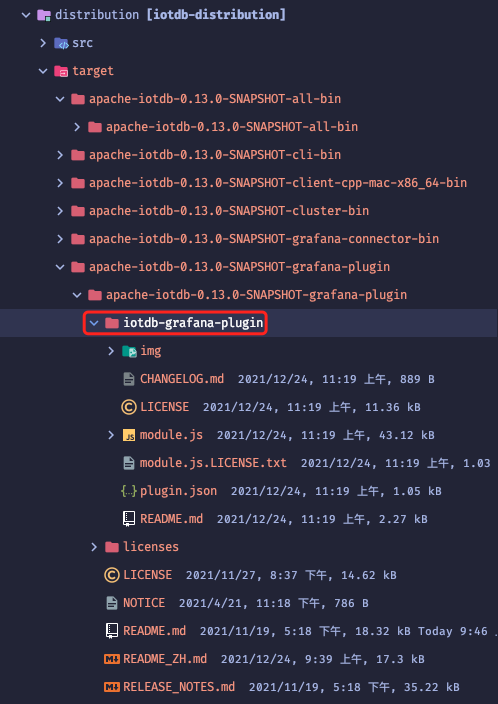
We can also obtain the front-end project of grafana-plugin and other IoTDB executable files by executing the package instruction of the IoTDB project.
Execute following command in the IoTDB root directory:
mvn clean package -pl distribution -am -DskipTests -P compile-grafana-pluginIf compiling successful, you can see that the distribution/target directory contains the compiled Grafana-Plugin:
Install Grafana-Plugin
Copy the front-end project target folder generated above to Grafana's plugin directory
${Grafana directory}\data\plugins\.If there is no such directory, you can manually create it or start grafana and it will be created automatically. Of course, you can also modify the location of plugins. For details, please refer to the following instructions for modifying the location of Grafana's plugin directory.Modify Grafana configuration file: the file is in(
${Grafana directory}\conf\defaults.ini), and do the following modifications:allow_loading_unsigned_plugins = iotdbModify the location of Grafana's plugin directory: the file is in(
${Grafana directory}\conf\defaults.ini), and do the following modifications:plugins = data/pluginsStart Grafana (restart if the Grafana service is already started)
For more details,please click here
Start Grafana
Start Grafana with the following command in the Grafana directory:
- Windows:
bin\grafana-server.exe- Linux:
sudo service grafana-server start- MacOS:
brew services start grafanaFor more details,please click here
Configure IoTDB REST Service
- Modify
{iotdb directory}/conf/iotdb-rest.propertiesas following:
# Is the REST service enabled
enable_rest_service=true

# the binding port of the REST service
rest_service_port=18080
Start IoTDB (restart if the IoTDB service is already started)
How to use Grafana-Plugin
Access Grafana dashboard
Grafana displays data in a web page dashboard. Please open your browser and visit http://<ip>:<port> when using it.
IP is the IP of the server where your Grafana is located, and Port is the running port of Grafana (default 3000).
The default login username and password are both
admin.
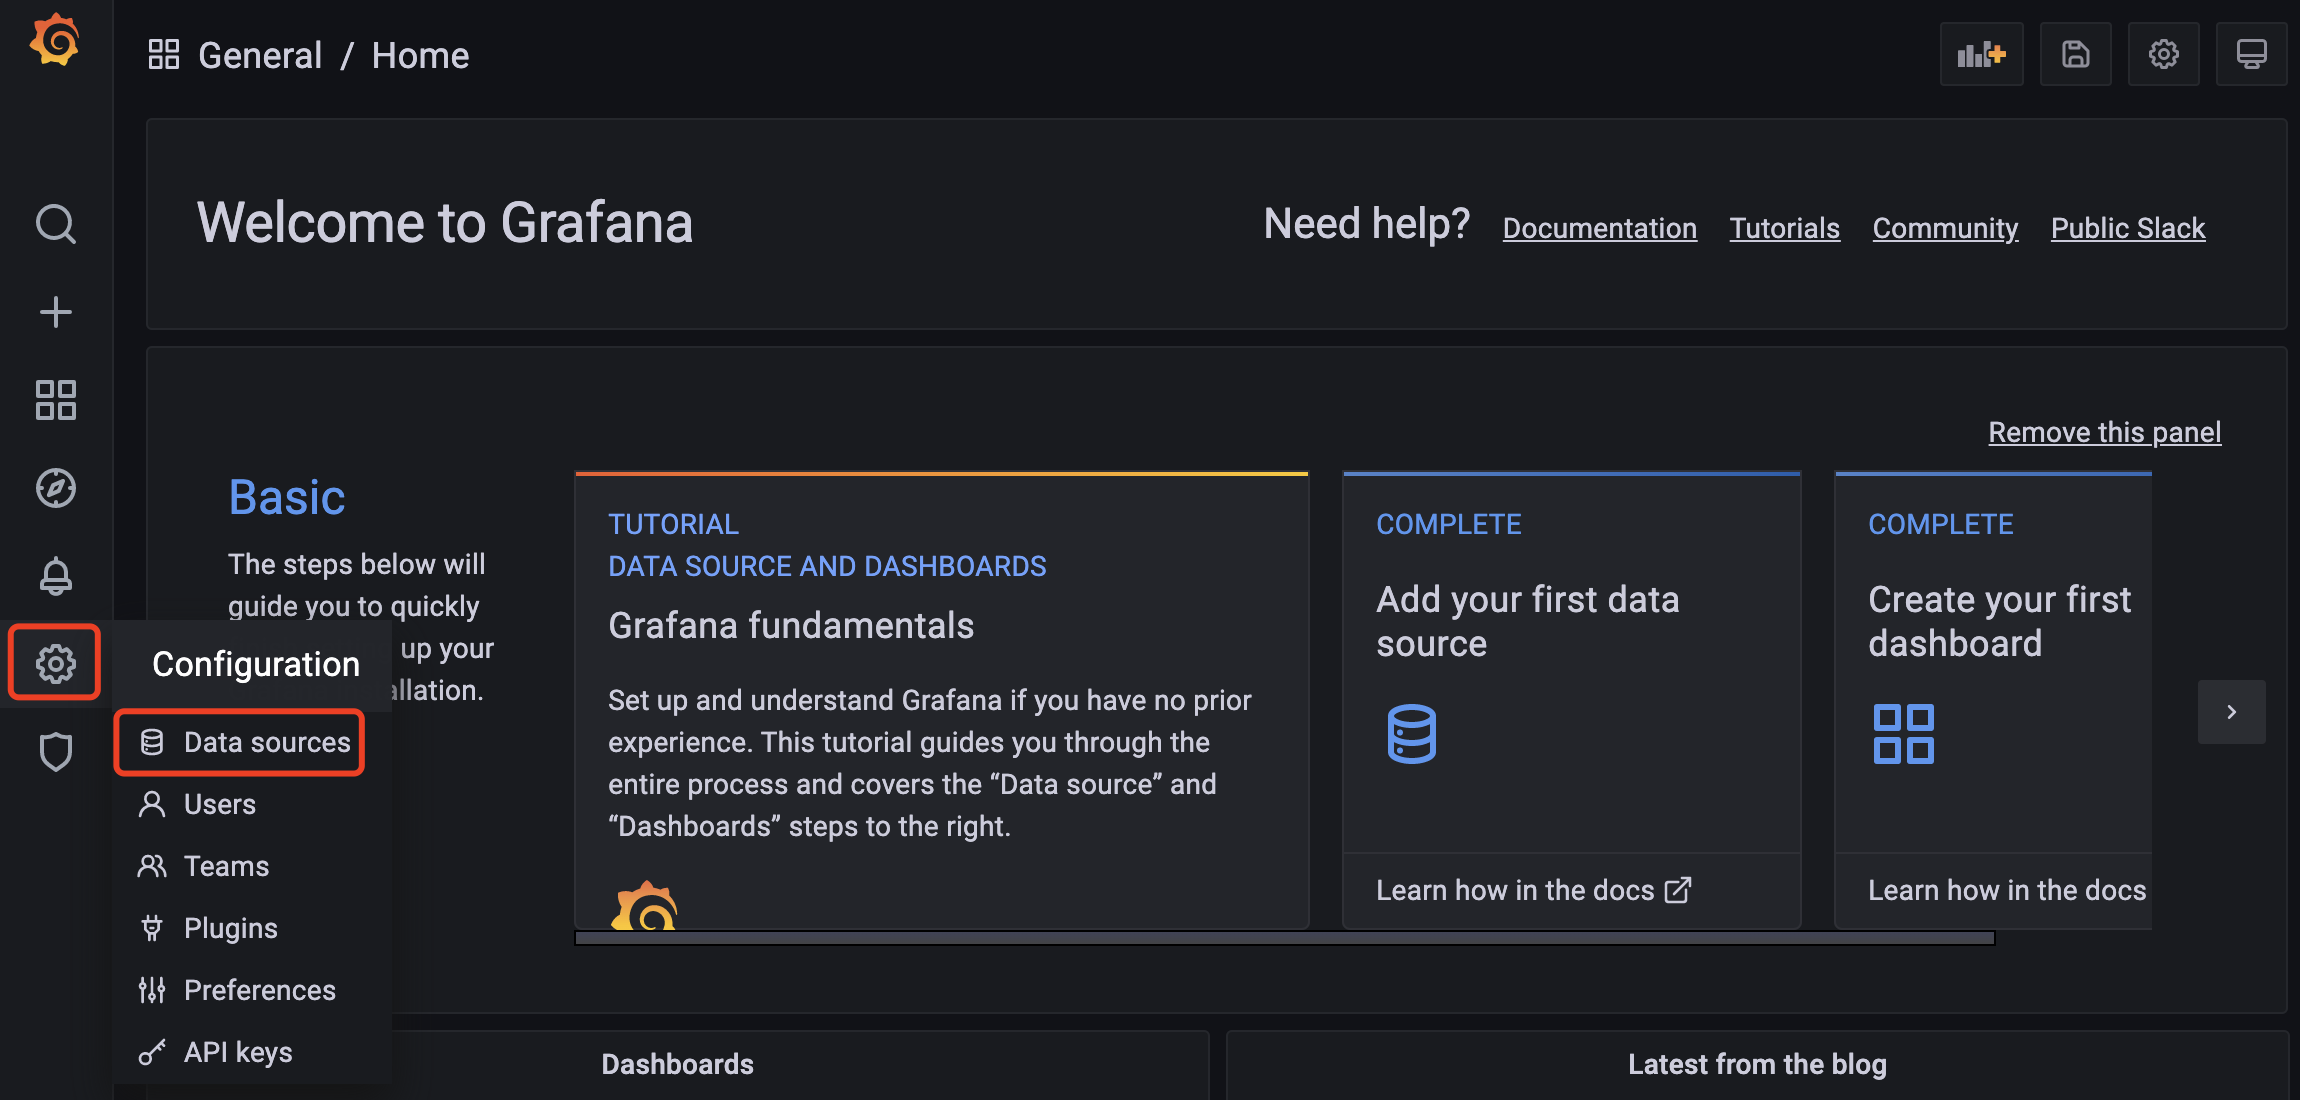
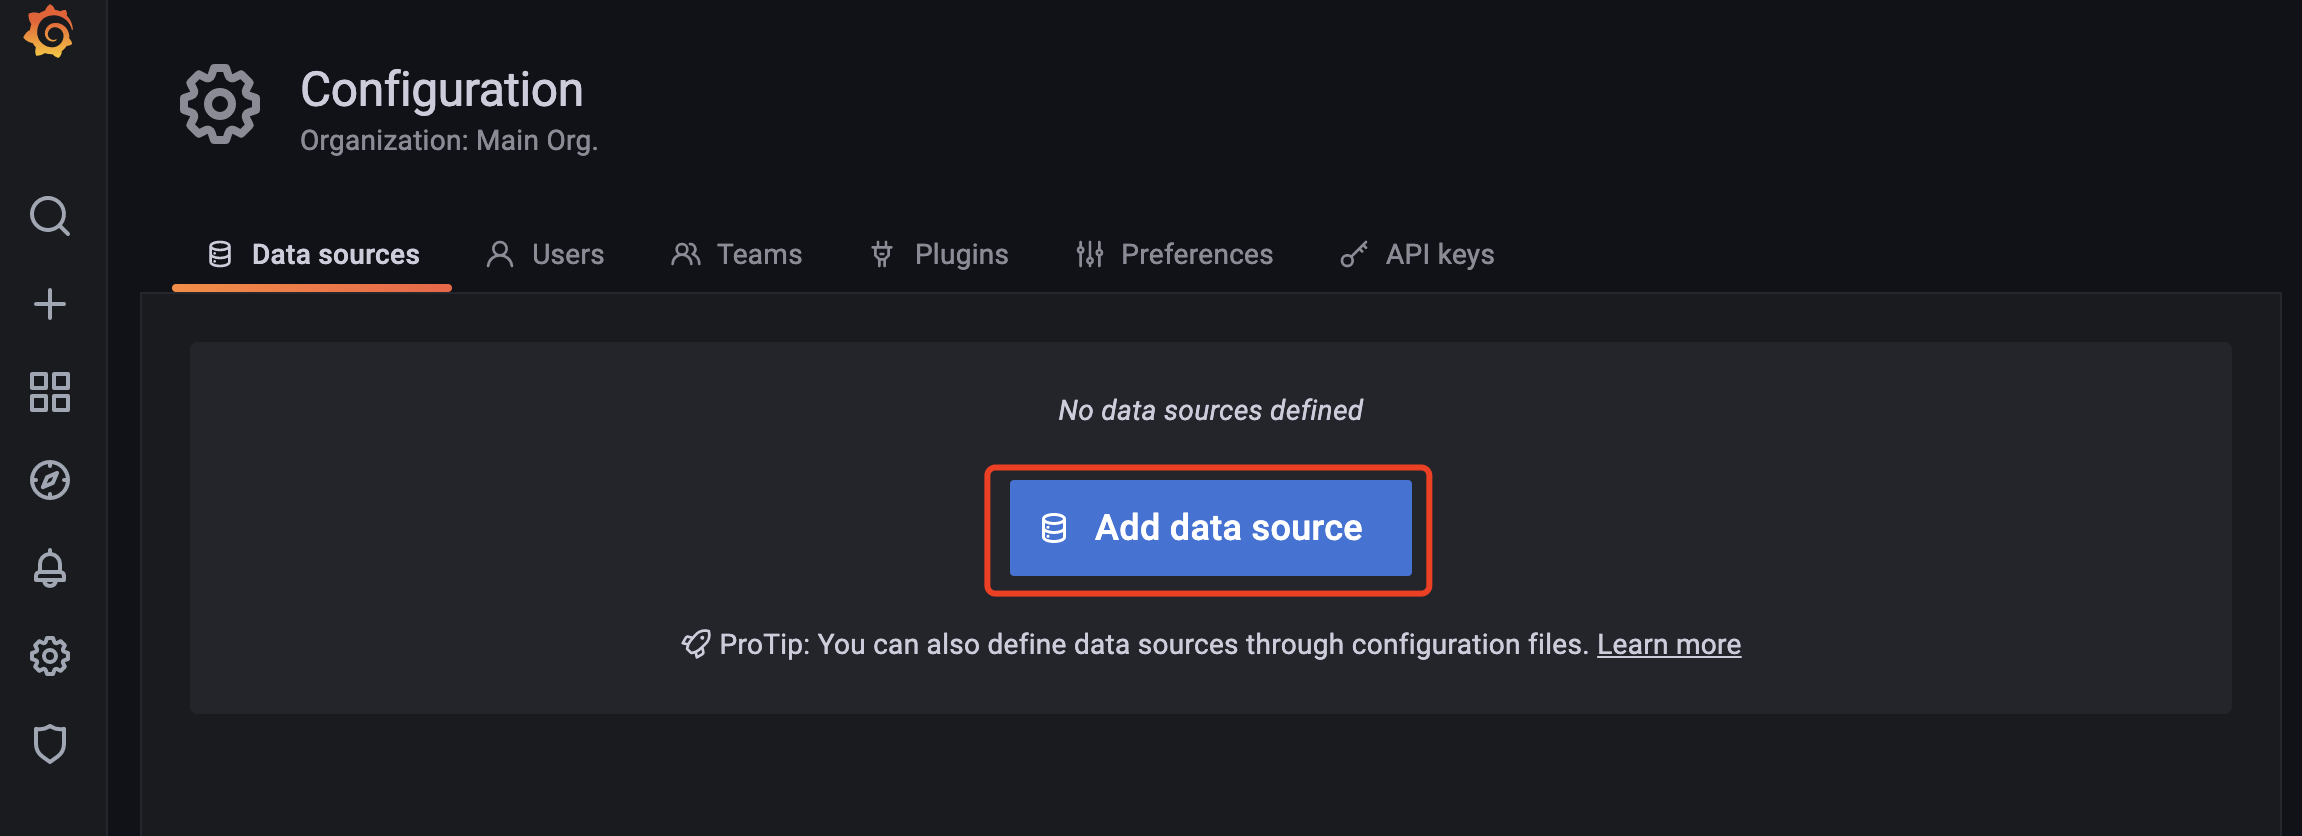
Add IoTDB as Data Source
Click the Settings icon on the left, select the Data Source option, and then click Add data source.
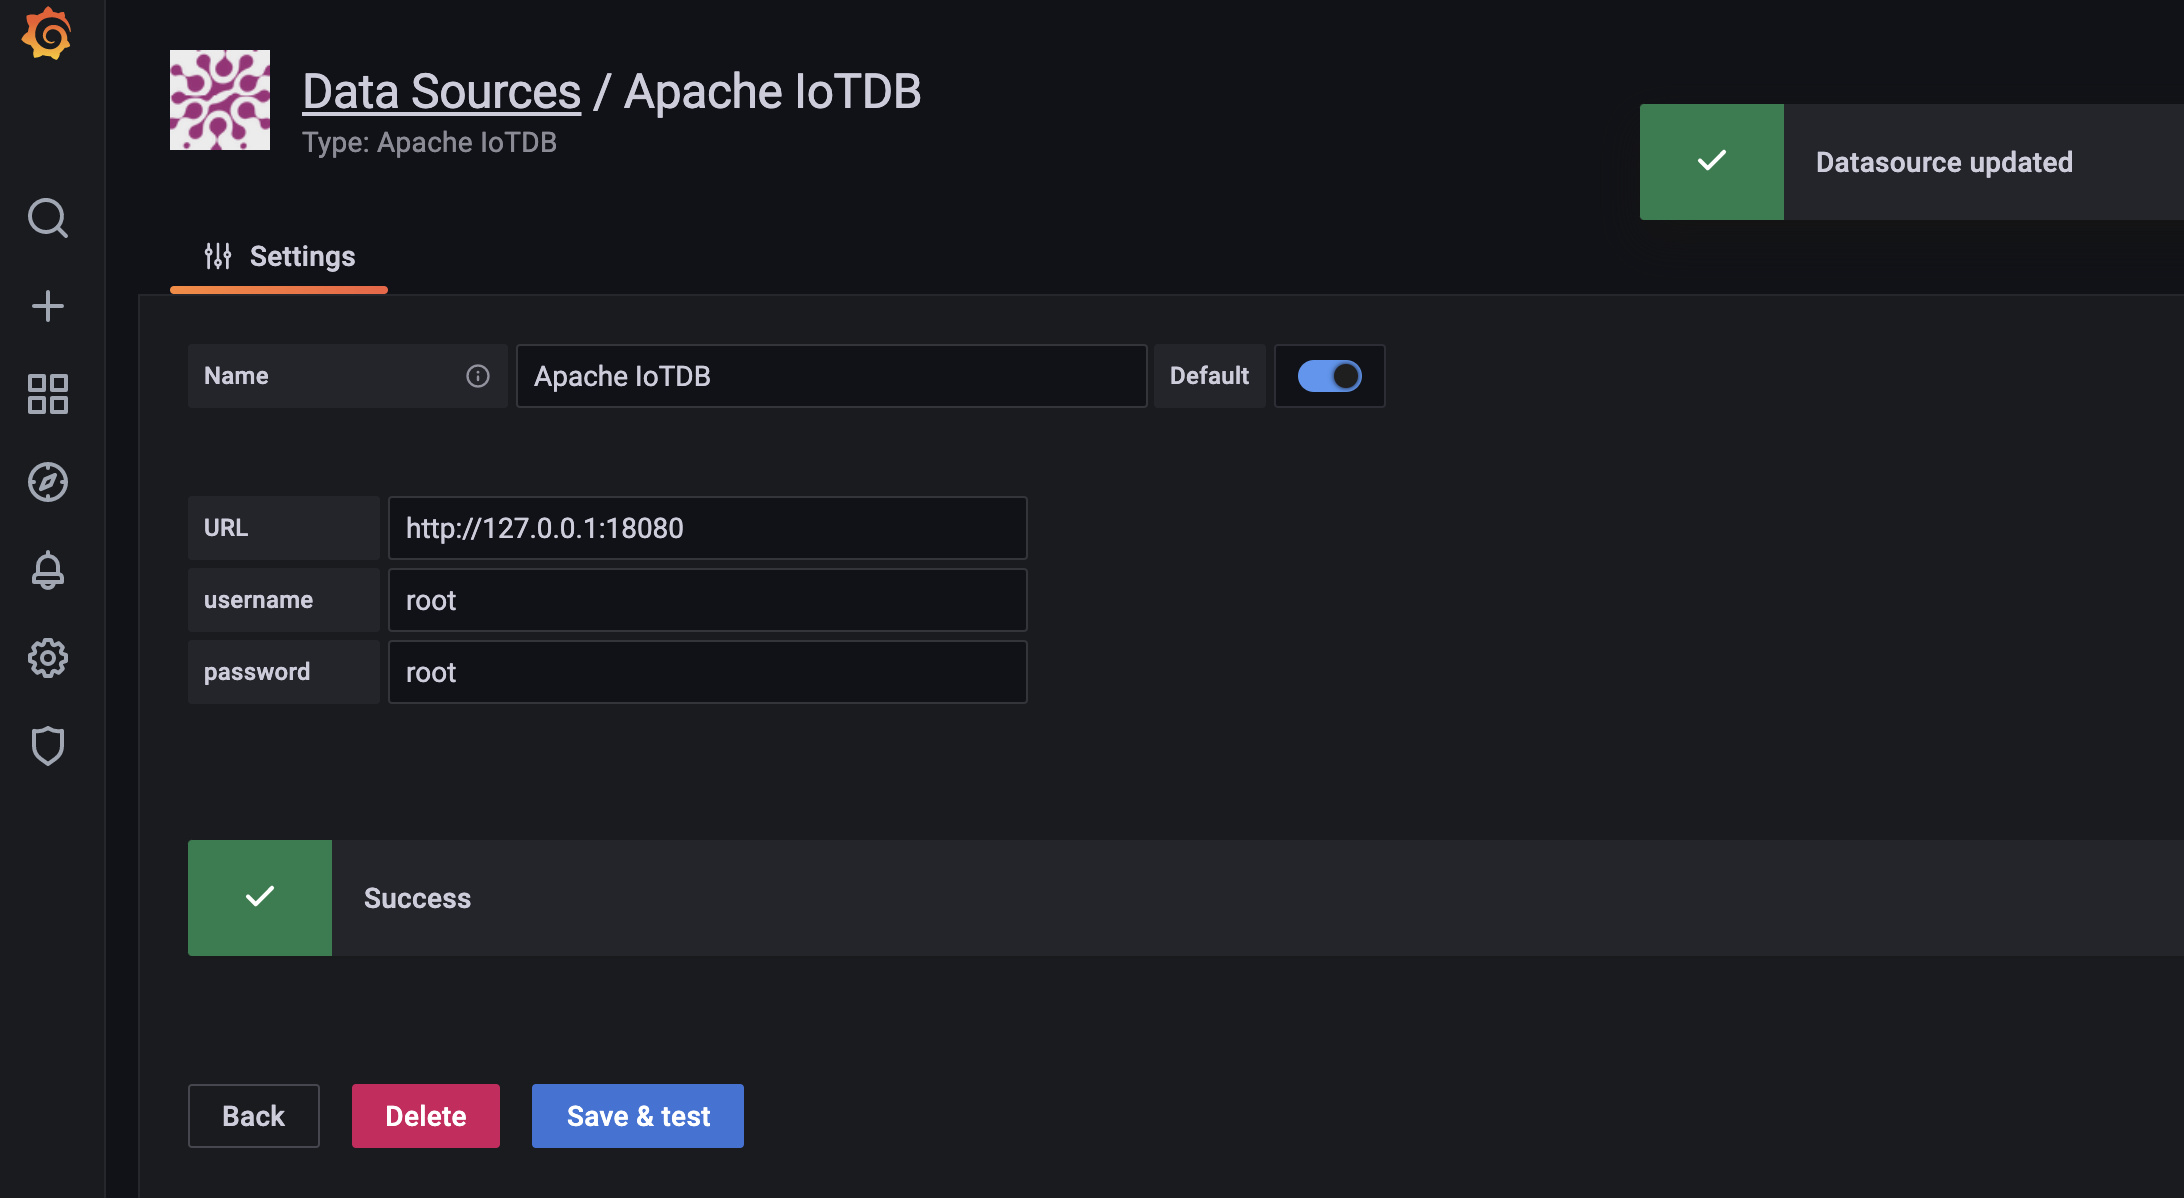
Select the Apache IoTDB data source.
- Fill in
http://<ip>:<port>in theURLfield- ip is the host ip where your IoTDB server is located
- port is the running port of the REST service (default 18080).
- Enter the username and password of the IoTDB server
Click Save & Test, and Success will appear.
Create a new Panel
Click the Dashboards icon on the left, and select Manage option.
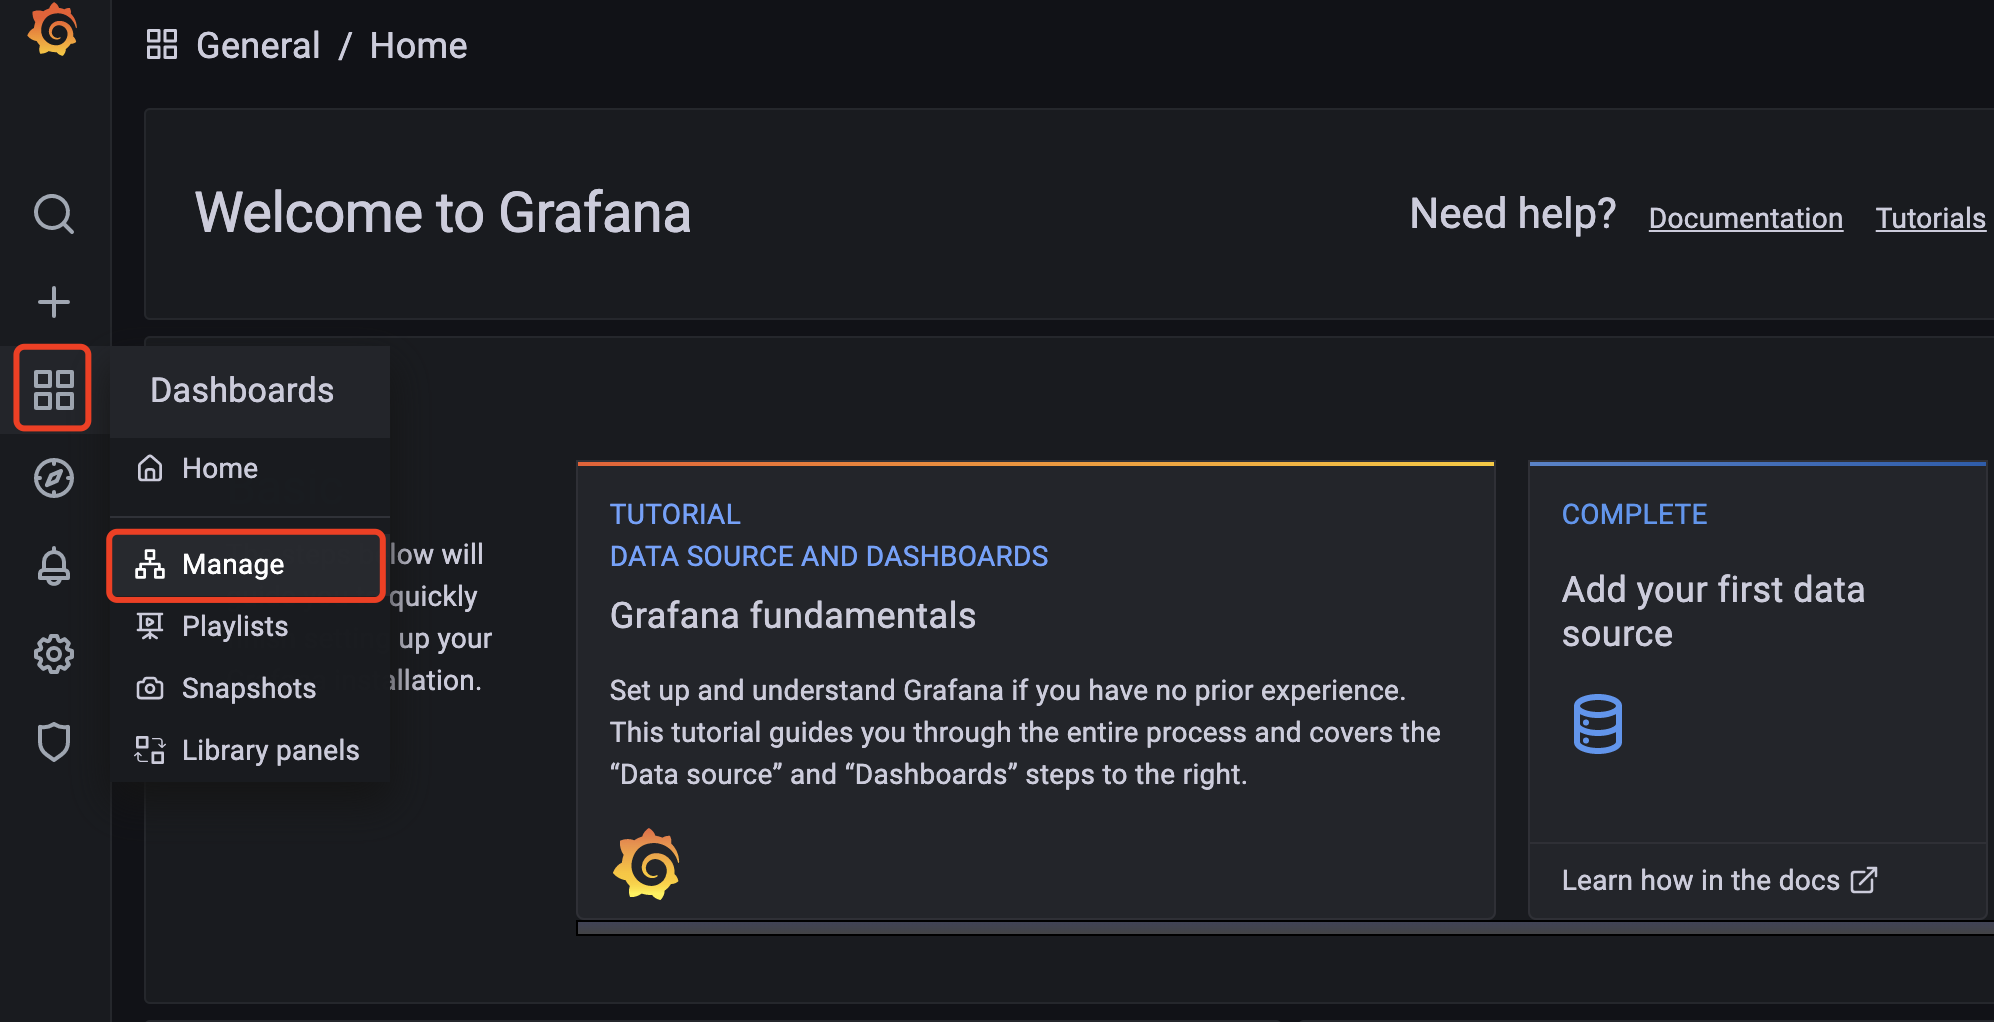
Click the New Dashboard icon on the top right, and select Add an empty panel option.
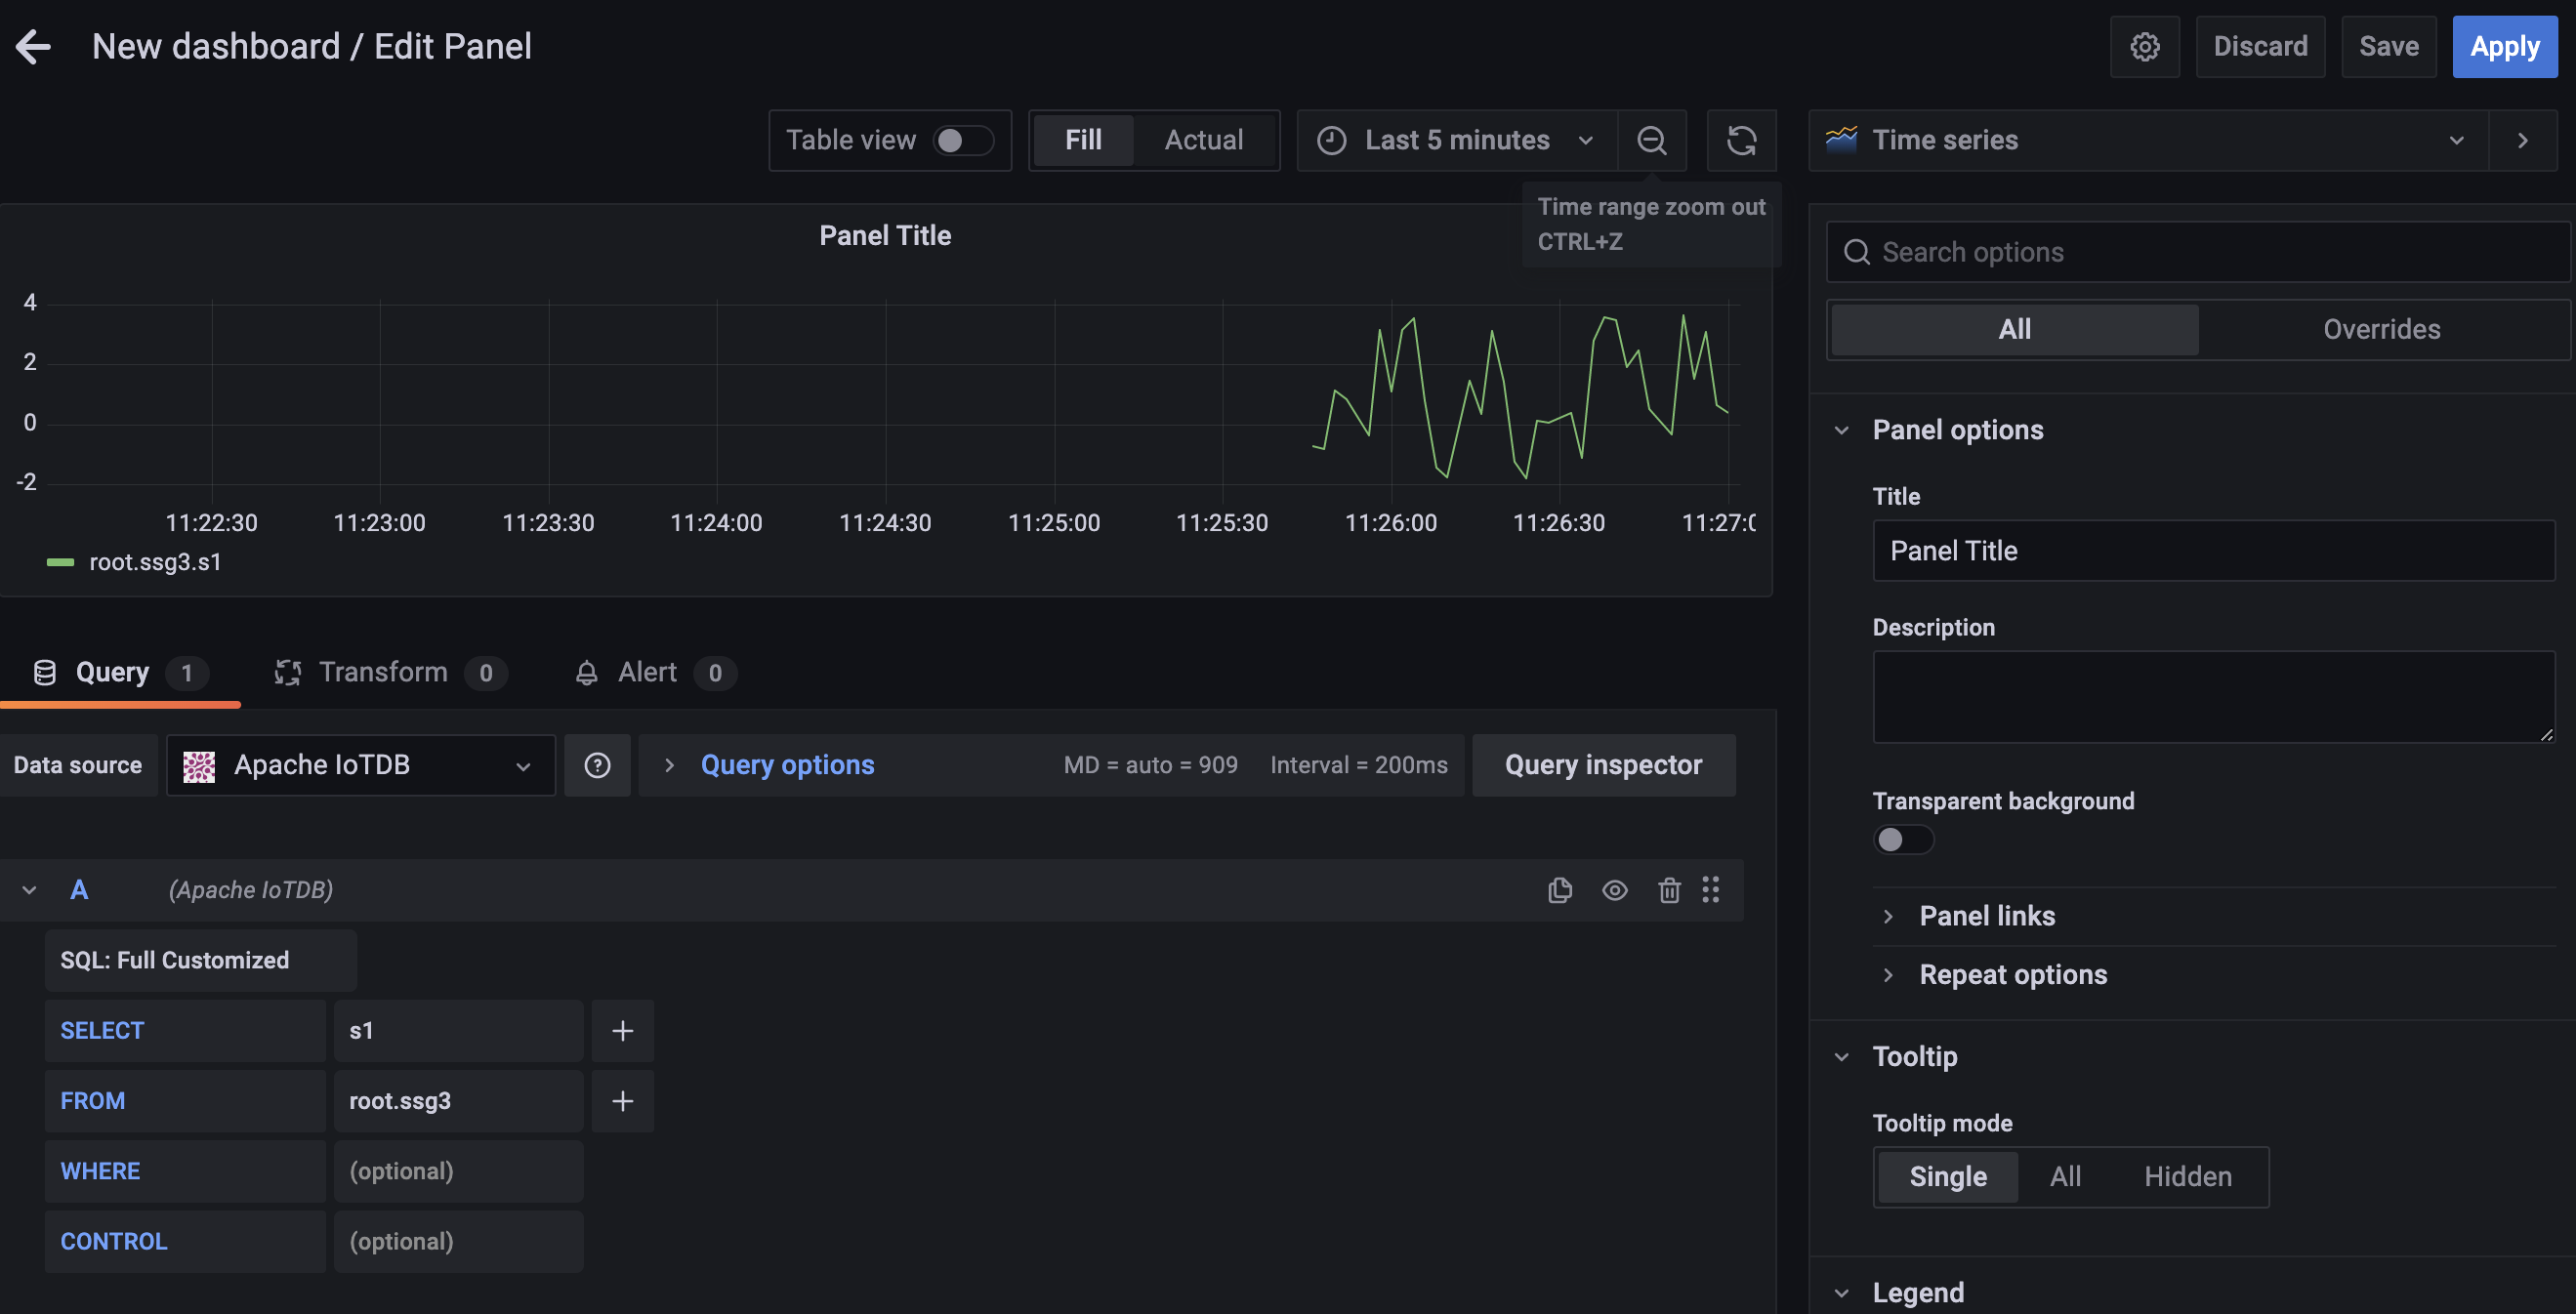
Enter content in the SELECT, FROM , WHERE and CONTROL input box, where the WHERE and CONTROL input boxes are optional.
If a query involves multiple expressions, we can click + on the right side of the SELECT input box to add expressions in the SELECT clause, or click + on the right side of the FROM input box to add a path prefix:
SELECT input box: contents can be the time series suffix, function, udf, arithmetic expression, or nested expressions. You can also use the as clause to rename the result.
Here are some examples of valid SELECT content:
s1top_k(s1, 'k'='1') as topsin(s1) + cos(s1 + s2)udf(s1) as "alias"
FROM input box: contents must be the prefix path of the time series, such as root.sg.d.
WHERE input box: contents should be the filter condition of the query, such as time > 0 or s1 < 1024 and s2 > 1024.
CONTROL input box: contents should be a special clause that controls the query type and output format.
Here are some examples of valid CONTROL content:
group by ([2017-11-01T00:00:00, 2017-11-07T23:00:00), 1d)group by ([2017-11-01 00:00:00, 2017-11-07 23:00:00), 3h, 1d)GROUP BY([2017-11-07T23:50:00, 2017-11-07T23:59:00), 1m) FILL (PREVIOUSUNTILLAST)GROUP BY([2017-11-07T23:50:00, 2017-11-07T23:59:00), 1m) FILL (PREVIOUS, 1m)GROUP BY([2017-11-07T23:50:00, 2017-11-07T23:59:00), 1m) FILL (LINEAR, 5m, 5m)group by ((2017-11-01T00:00:00, 2017-11-07T23:00:00], 1d), level=1group by ([0, 20), 2ms, 3ms), level=1
Tip: Statements like select * from root.xx.** are not recommended because those statements may cause OOM.
Support for variables and template functions
This plugin supports Grafana's variables and templates (https://grafana.com/docs/grafana/v7.0/variables/) feature.
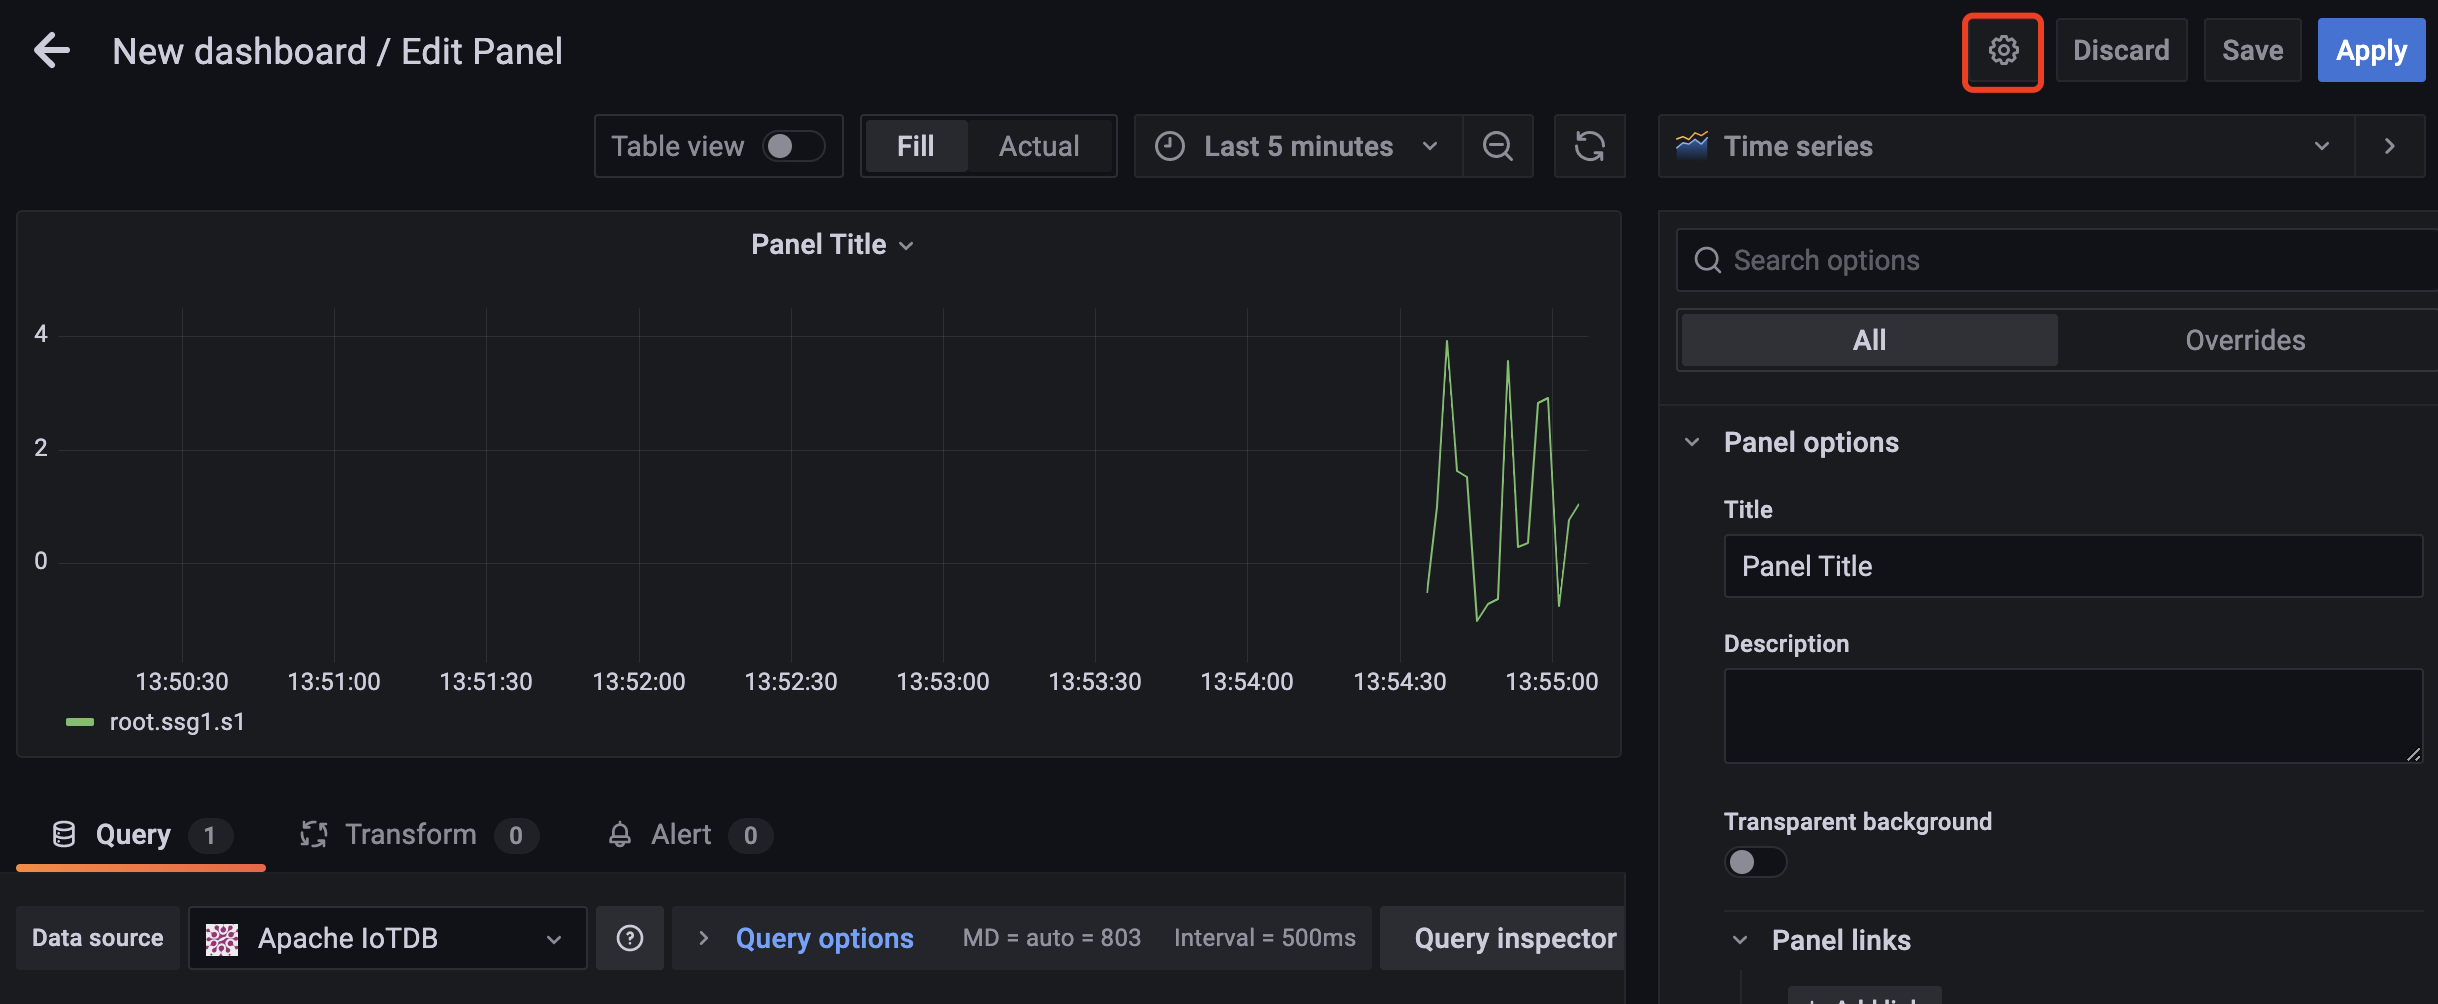
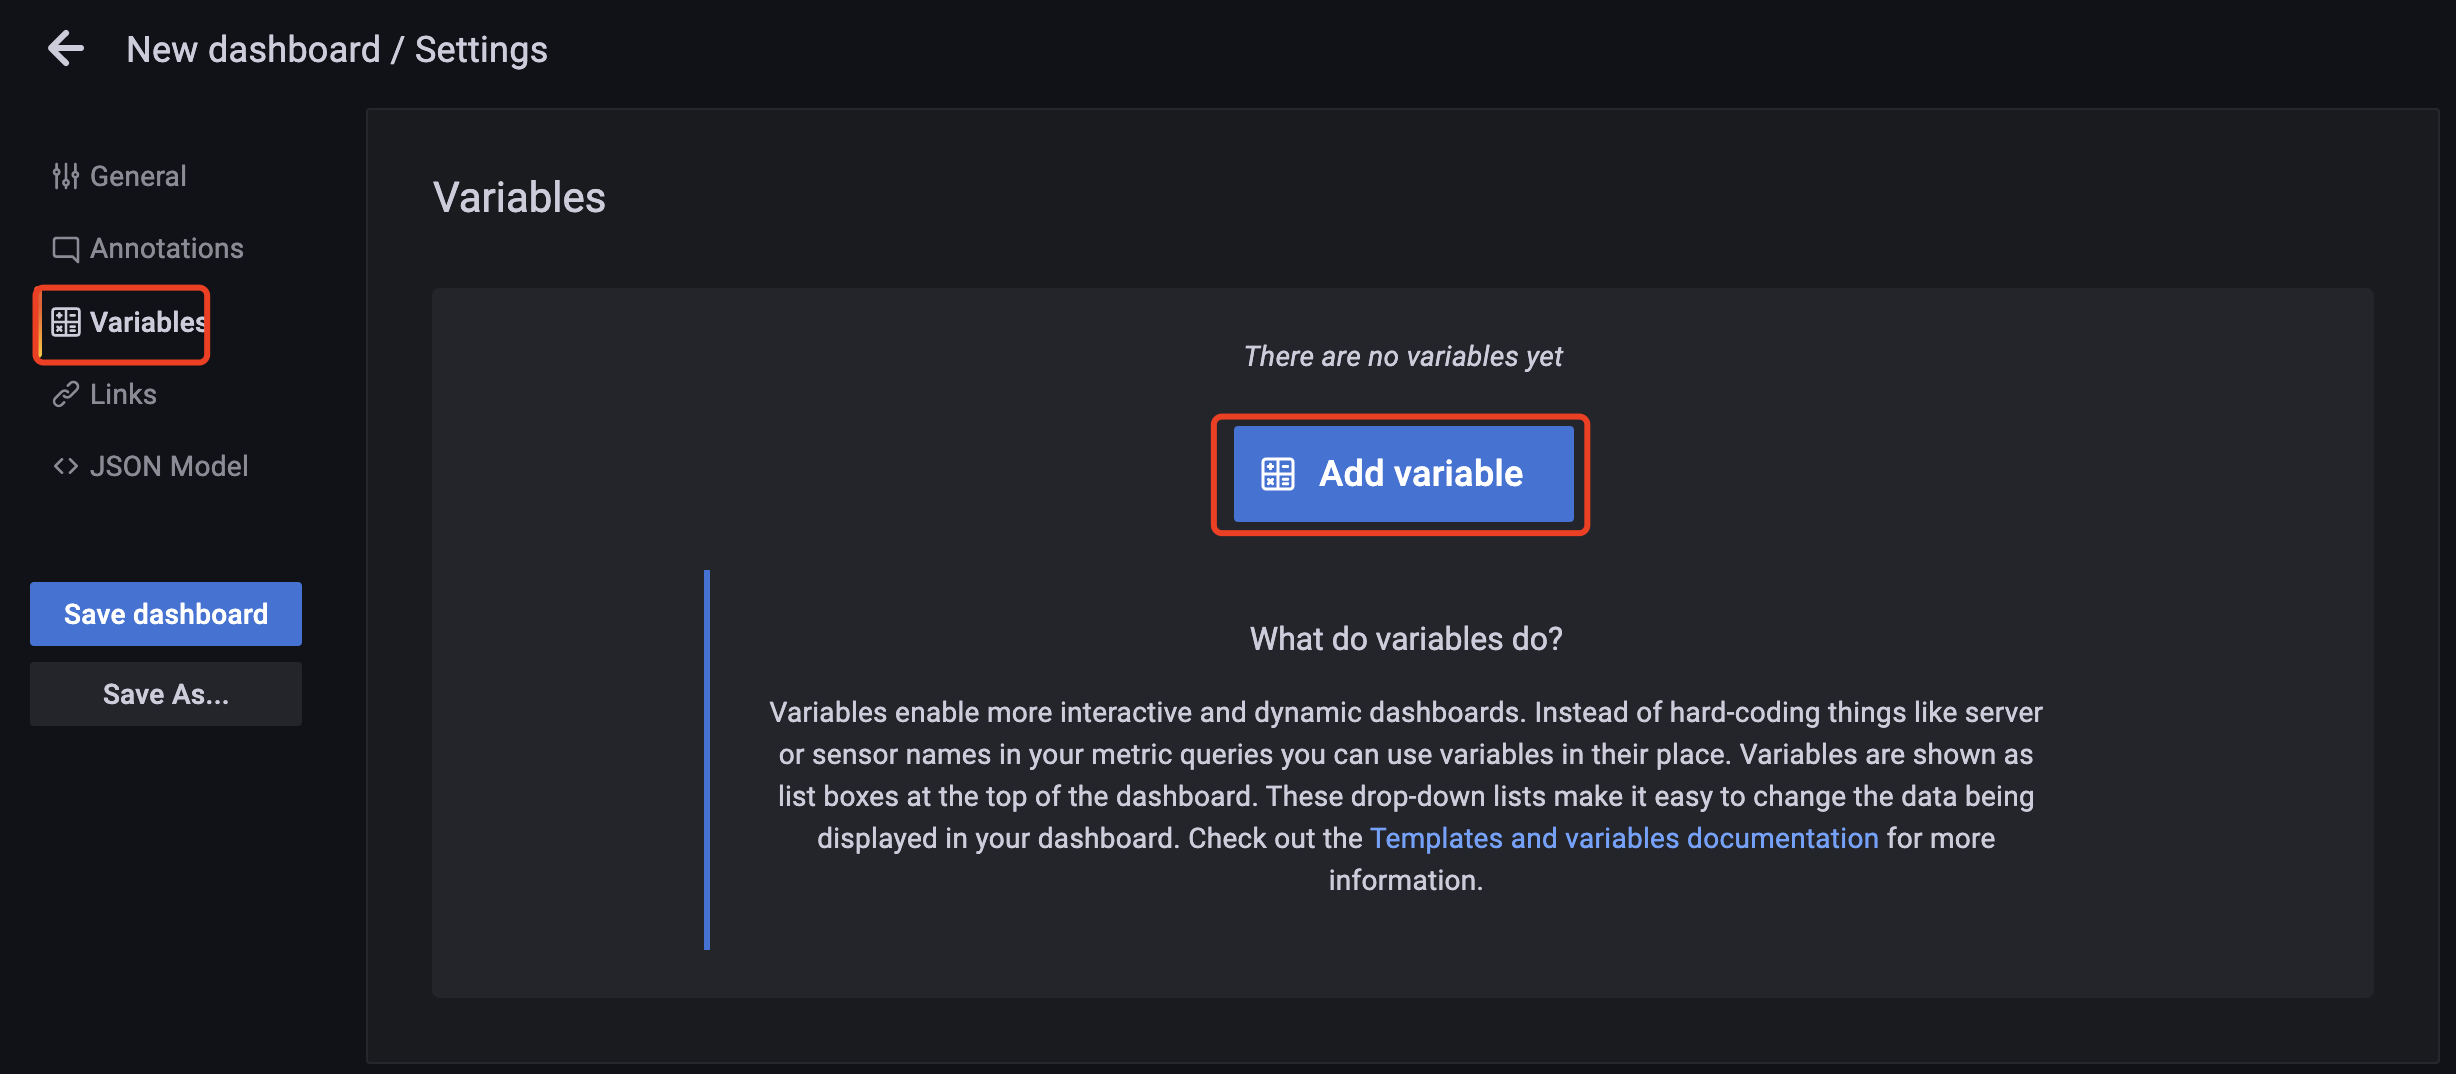
After creating a new Panel, click the Settings button in the upper right corner:
Select Variables, click Add variable:
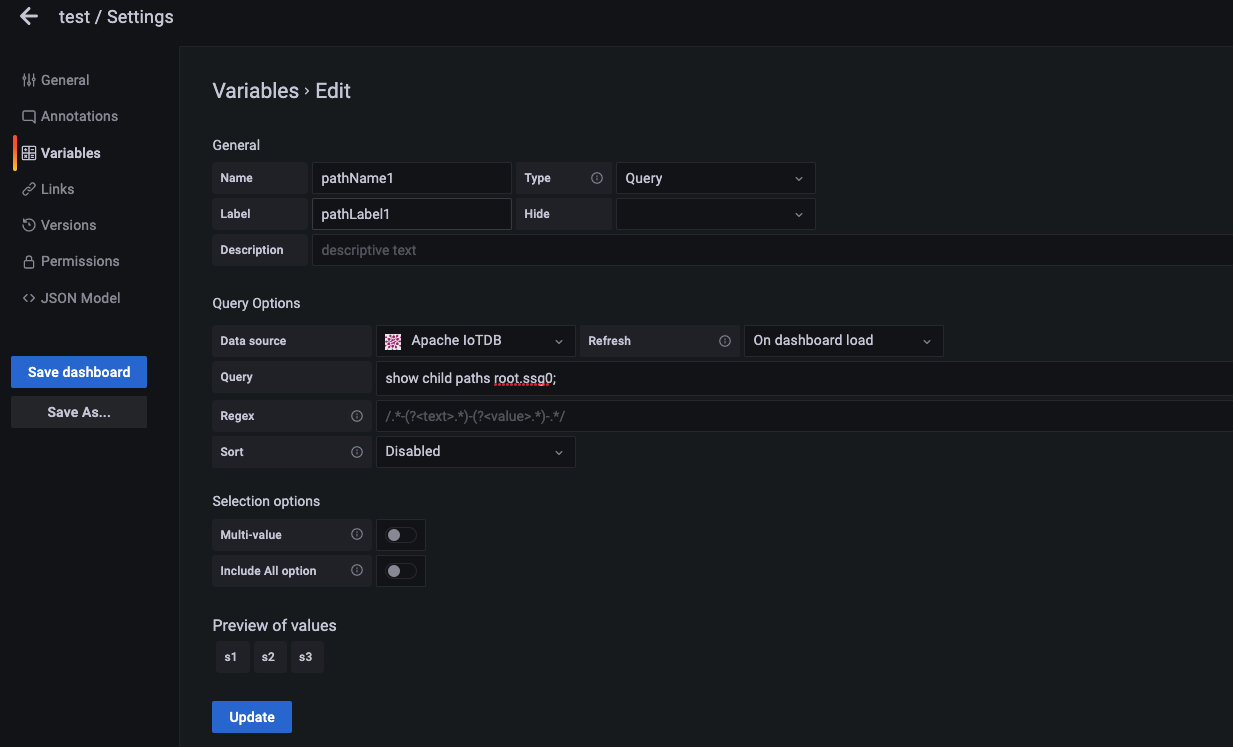
Enter Name, Label, and Query, and then click the Update button:
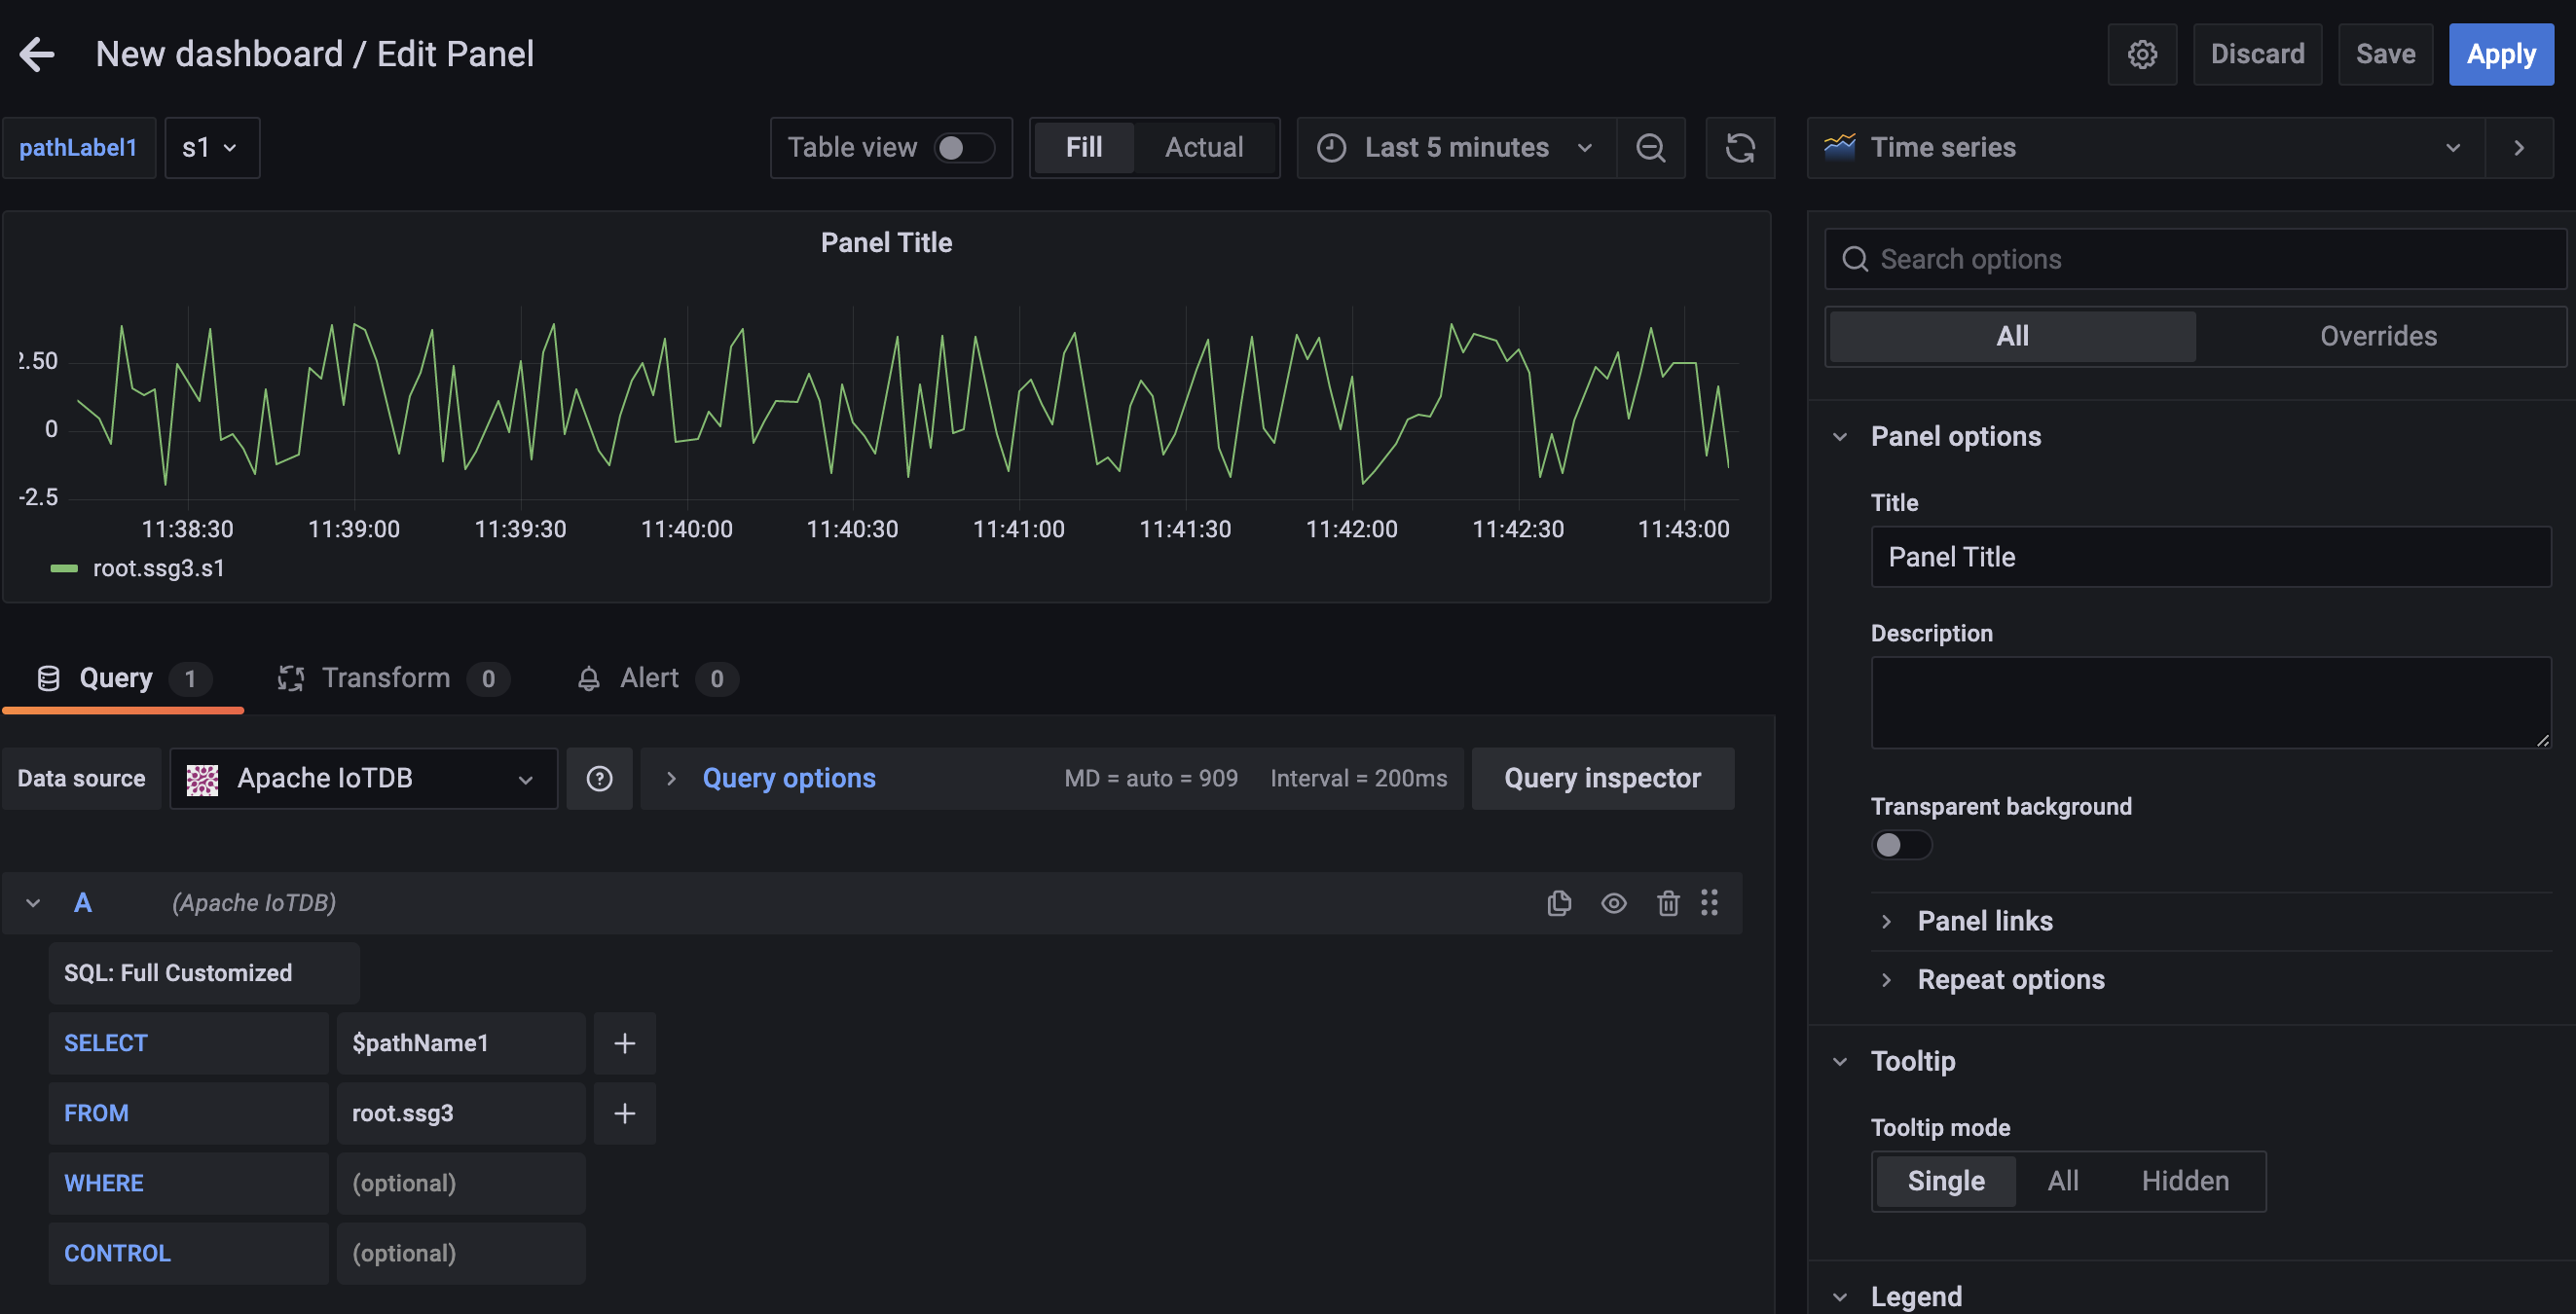
Apply Variables, enter the variable in the grafana panel and click the save button:
More Details about Grafana
For more details about Grafana operation, please refer to the official Grafana documentation: http://docs.grafana.org/guides/getting_started/.