Ecosystem Integration
Ecosystem Integration
Grafana-IoTDB-Connector
Grafana is an open source volume metrics monitoring and visualization tool, which can be used to display time series data and application runtime analysis. Grafana supports Graphite, InfluxDB and other major time series databases as data sources. IoTDB-Grafana-Connector is a connector which we developed to show time series data in IoTDB by reading data from IoTDB and sends to Grafana(https://grafana.com/). Before using this tool, make sure Grafana and IoTDB are correctly installed and started.
Installation and deployment
Install Grafana
- Download url: https://grafana.com/grafana/download
- Version >= 4.4.1
Install data source plugin
- Plugin name: simple-json-datasource
- Download url: https://github.com/grafana/simple-json-datasource
After downloading this plugin, use the grafana-cli tool to install SimpleJson from the commandline:
grafana-cli plugins install grafana-simple-json-datasourceAlternatively, manually download the .zip file and unpack it into grafana plugins directory.
{grafana-install-directory}\data\plugins\(Windows)/var/lib/grafana/plugins(Linux)/usr/local/var/lib/grafana/plugins(Mac)
Then you need to restart grafana server, then you can use browser to visit grafana.
If you see "SimpleJson" in "Type" of "Add data source" pages, then it is install successfully.
Or, if you meet following errors:
Unsigned plugins were found during plugin initialization. Grafana Labs cannot guarantee the integrity of these plugins. We recommend only using signed plugins.
The following plugins are disabled and not shown in the list below:
Please try to find config file of grafana(eg. customer.ini in windows, and /etc/grafana/grafana.ini in linux), then add following configuration:
allow_loading_unsigned_plugins = "grafana-simple-json-datasource"Start Grafana
If Unix is used, Grafana will start automatically after installing, or you can run sudo service grafana-server start command. See more information here.
If Mac and homebrew are used to install Grafana, you can use homebrew to start Grafana.
First make sure homebrew/services is installed by running brew tap homebrew/services, then start Grafana using: brew services start grafana.
See more information here.
If Windows is used, start Grafana by executing grafana-server.exe, located in the bin directory, preferably from the command line. See more information here.
IoTDB installation
See https://github.com/apache/iotdb
IoTDB-Grafana-Connector installation
git clone https://github.com/apache/iotdb.gitStart IoTDB-Grafana-Connector
- Option one
Import the entire project, after the maven dependency is installed, directly runiotdb/grafana-connector/rc/main/java/org/apache/iotdb/web/grafanadirectory TsfileWebDemoApplication.java, this grafana connector is developed by springboot
- Option two
In /grafana/target/directory
cd iotdb
mvn clean package -pl grafana-connector -am -Dmaven.test.skip=true
cd grafana/target
java -jar iotdb-grafana-connector-{version}.war
If following output is displayed, then iotdb-grafana-connector connector is successfully activated.
$ java -jar iotdb-grafana-connector-{version}.war

  .   ____          _            __ _ _
 /\\ / ___'_ __ _ _(_)_ __  __ _ \ \ \ \
( ( )\___ | '_ | '_| | '_ \/ _` | \ \ \ \
 \\/  ___)| |_)| | | | | || (_| |  ) ) ) )
  '  |____| .__|_| |_|_| |_\__, | / / / /
 =========|_|==============|___/=/_/_/_/
 :: Spring Boot ::        (v1.5.4.RELEASE)
...
To configure properties, move the grafana-connector/src/main/resources/application.properties to the same directory as the war package (grafana/target)
Explore in Grafana
The default port of Grafana is 3000, see http://localhost:3000/
Username and password are both "admin" by default.
Add data source
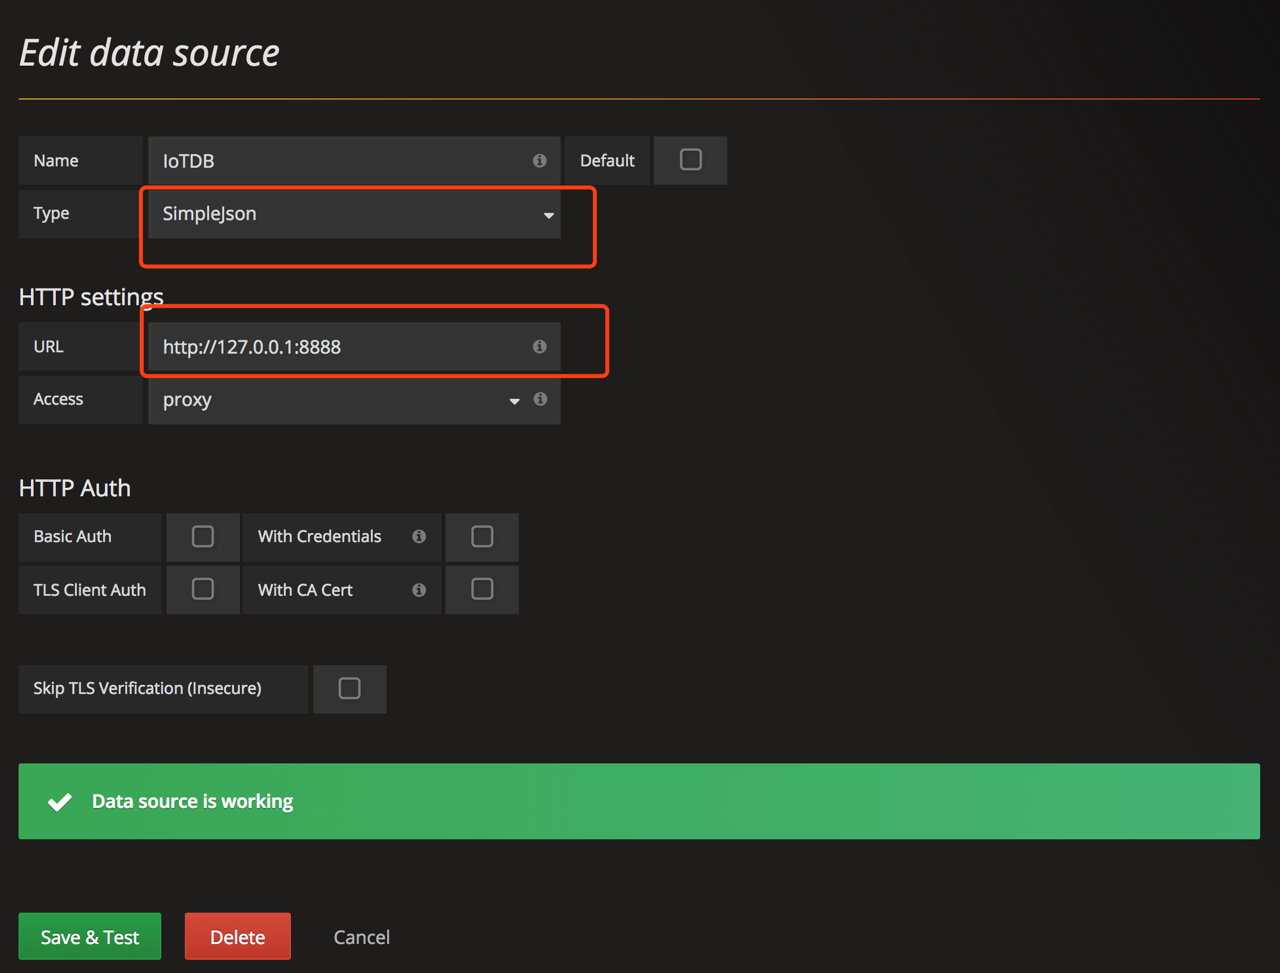
Select Data Sources and then Add data source, select SimpleJson in Type and URL is http://localhost:8888.
After that, make sure IoTDB has been started, click "Save & Test", and "Data Source is working" will be shown to indicate successful configuration.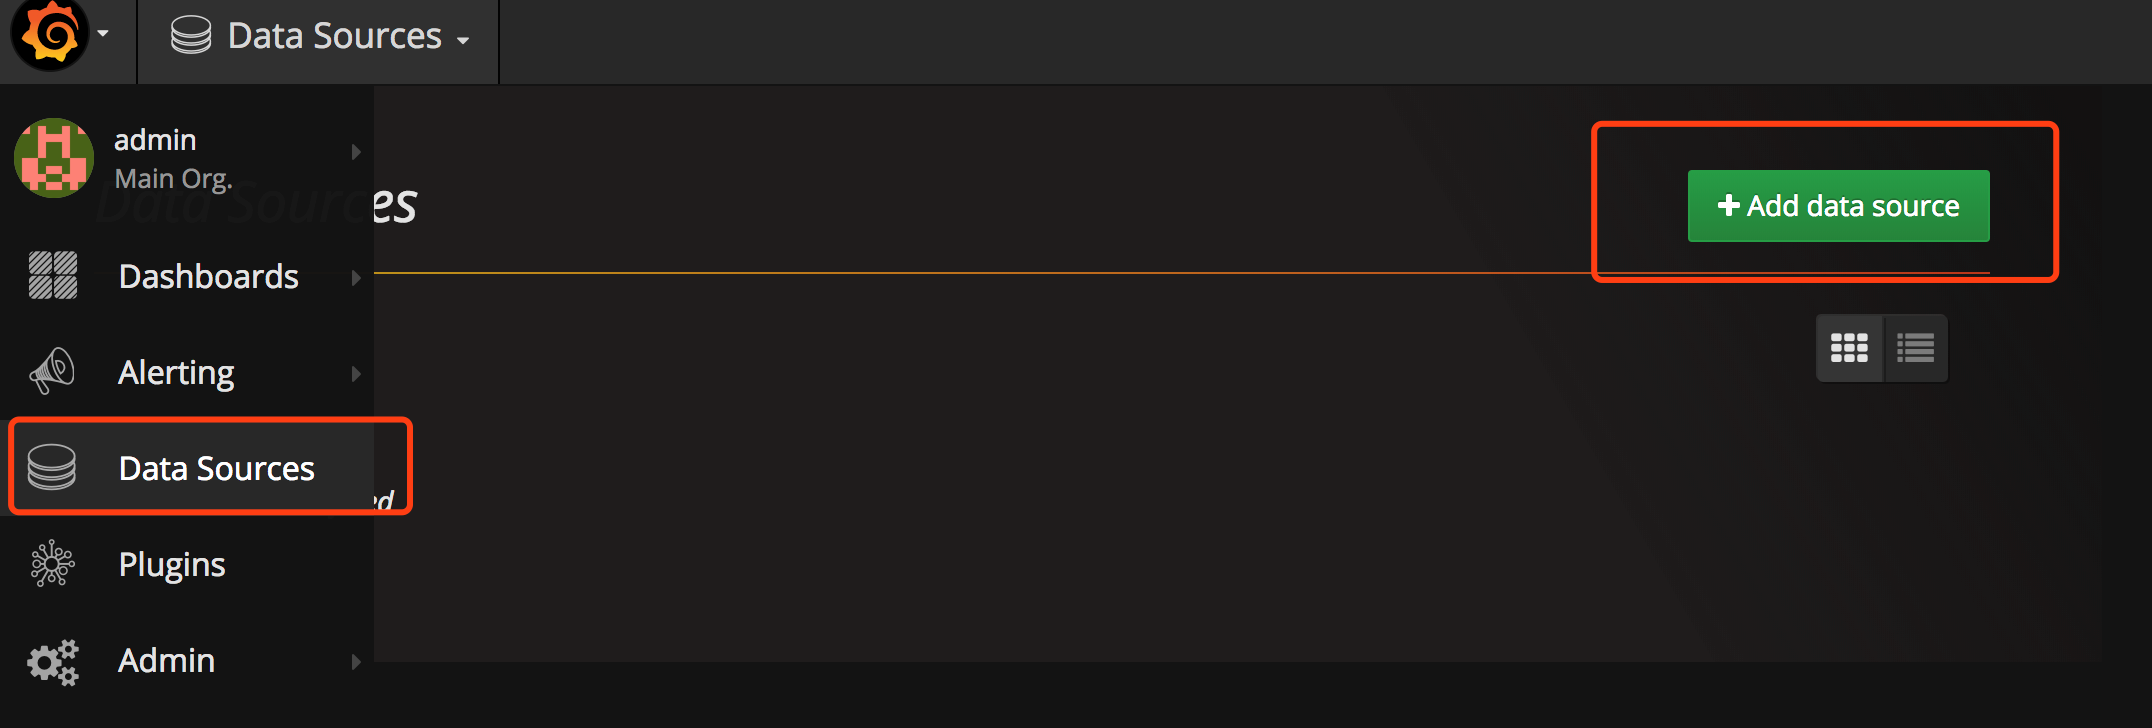
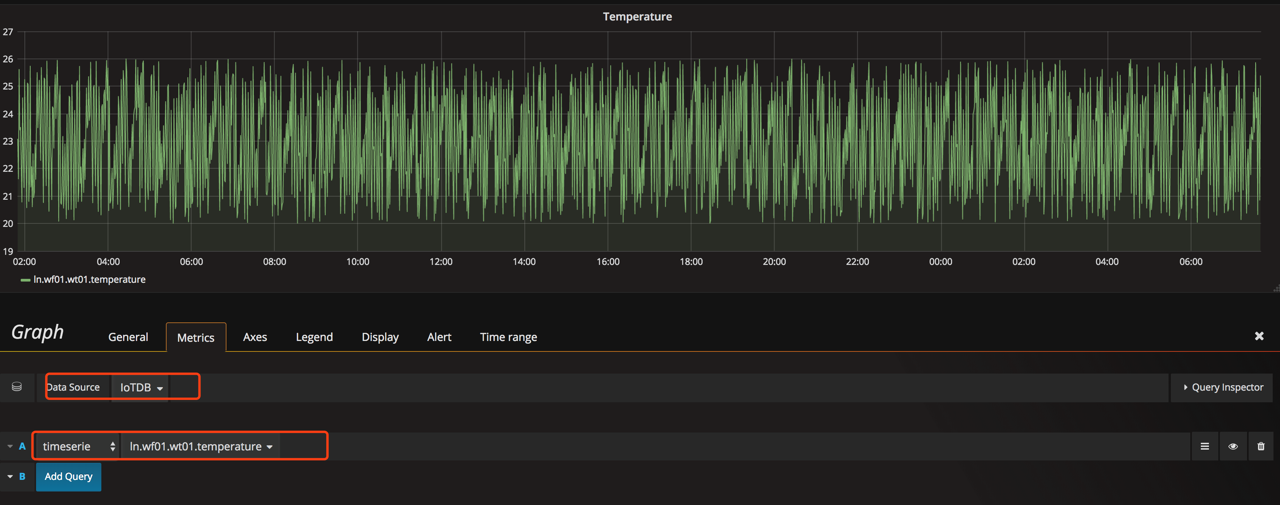
Design in dashboard
Add diagrams in dashboard and customize your query. See http://docs.grafana.org/guides/getting_started/
config grafana
# ip and port of IoTDB
spring.datasource.url=jdbc:iotdb://127.0.0.1:6667/
spring.datasource.username=root
spring.datasource.password=root
spring.datasource.driver-class-name=org.apache.iotdb.jdbc.IoTDBDriver
server.port=8888
# Use this value to set timestamp precision as "ms", "us" or "ns", which must to be same with the timestamp
# precision of Apache IoTDB engine.
timestamp_precision=ms

# Use this value to set down sampling true/false
isDownSampling=true
# defaut sampling intervals
interval=1m
# aggregation function to use to downsampling the data (int, long, float, double)
# COUNT, FIRST_VALUE, LAST_VALUE, MAX_TIME, MAX_VALUE, AVG, MIN_TIME, MIN_VALUE, NOW, SUM
continuous_data_function=AVG
# aggregation function to use to downsampling the data (boolean, string)
# COUNT, FIRST_VALUE, LAST_VALUE, MAX_TIME, MIN_TIME, NOW
discrete_data_function=LAST_VALUE
The specific configuration information of interval is as follows
<1h: no sampling
1h~1d : intervals = 1m
1d~30d:intervals = 1h
>30d:intervals = 1d
After configuration, please re-run war package
java -jar iotdb-grafana-connector-{version}.war