1. Monitor Framework
Currently, users can use various methods to monitor the running IoTDB process, including using Java's Jconsole tool to monitor the system status of the running IoTDB process, using the interface developed by IoTDB for users to view data statistics, and using the monitor framework to monitor the system status of the running IoTDB process.
1. Monitor Framework
Along with IoTDB running, some metrics reflecting current system's status will be collected continuously, which will provide some useful information helping us resolving system problems and detecting potential system risks.
1.1. When to use monitor framework?
Belows are some typical application scenarios
System is running slowly
When system is running slowly, we always hope to have information about system's running status as detail as possible, such as
- JVM:Is there FGC?How long does it cost?How much does the memory usage decreased after GC?Are there lots of threads?
- System:Is the CPU usage too hi?Are there many disk IOs?
- Connections:How many connections are there in the current time?
- Interface:What is the TPS and latency of every interface?
- ThreadPool:Are there many pending tasks?
- Cache Hit Ratio
No space left on device
When meet a "no space left on device" error, we really want to know which kind of data file had a rapid rise in the past hours.
Is the system running in abnormal status
We could use the count of error logs、the alive status of nodes in cluster, etc, to determine whether the system is running abnormally.
1.2. Who will use monitor framework?
Any person cares about the system's status, including but not limited to RD, QA, SRE, DBA, can use the metrics to work more efficiently.
1.3. What metrics does IoTDB have?
For now, we have provided some metrics for several core modules of IoTDB, and more metrics will be added or updated along with the development of new features and optimization or refactoring of architecture.
1.3.1. Key Concept
Before step into next, we'd better stop to have a look into some key concepts about metrics.
Every metric data has two properties
Metric Name
The name of this metric,for example,
logback_events_totalindicates the total count of log events。Tag
Each metric could have 0 or several sub classes (Tag), for the same example, the
logback_events_totalmetric has a sub class namedlevel, which meansthe total count of log events at the specific level
1.3.2. Data Format
IoTDB provides metrics data both in JMX and Prometheus format. For JMX, you can get these metrics via org.apache.iotdb.metrics.
Next, we will choose Prometheus format data as samples to describe each kind of metric.
1.3.3. IoTDB Metrics
1.3.3.1. API
| Metric | Tag | level | Description | Sample |
|---|---|---|---|---|
| entry_seconds_count | name="" | important | The total request count of the interface | entry_seconds_count{name="openSession",} 1.0 |
| entry_seconds_sum | name="" | important | The total cost seconds of the interface | entry_seconds_sum{name="openSession",} 0.024 |
| entry_seconds_max | name="" | important | The max latency of the interface | entry_seconds_max{name="openSession",} 0.024 |
| quantity_total | name="pointsIn" | important | The total points inserted into IoTDB | quantity_total{name="pointsIn",} 1.0 |
| thrift_connections | name="" | core | current number of thrift connections | thrift_connections{name="RPC",} 1.0 |
1.3.3.2. Task
| Metric | Tag | level | Description | Sample |
|---|---|---|---|---|
| queue | name="compaction_inner/compaction_cross/flush", status="running/waiting" | important | The count of current tasks in running and waiting status | queue{name="flush",status="waiting",} 0.0 queue{name="flush",status="running",} 0.0 |
| cost_task_seconds_count | name="compaction/flush" | important | The total count of tasks occurs till now | cost_task_seconds_count{name="flush",} 1.0 |
| cost_task_seconds_max | name="compaction/flush" | important | The seconds of the longest task takes till now | cost_task_seconds_max{name="flush",} 0.363 |
| cost_task_seconds_sum | name="compaction/flush" | important | The total cost seconds of all tasks till now | cost_task_seconds_sum{name="flush",} 0.363 |
| data_written_total | name="compaction", type="aligned/not-aligned/total" | important | The size of data written in compaction | data_written{name="compaction",type="total",} 10240 |
| data_read_total | name="compaction" | important | The size of data read in compaction | data_read={name="compaction",} 10240 |
1.3.3.3. Memory Usage
| Metric | Tag | level | Description | Sample |
|---|---|---|---|---|
| mem | name="chunkMetaData/storageGroup/schemaUsage/schemaRemaining" | important | Current memory size of chunkMetaData/storageGroup/schema usage/schema remaining memory in bytes | mem{name="chunkMetaData",} 2050.0 |
1.3.3.4. Cache
| Metric | Tag | level | Description | Sample |
|---|---|---|---|---|
| cache_hit | name="chunk/timeSeriesMeta/bloomFilter" | important | Cache hit ratio of chunk/timeSeriesMeta and prevention ratio of bloom filter | cache_hit{name="chunk",} 80 |
1.3.3.5. Business Data
| Metric | Tag | level | Description | Sample |
|---|---|---|---|---|
| quantity | name="timeSeries/storageGroup/device/deviceUsingTemplate", type="total/normal/template/template" | important | The current count of timeSeries/storageGroup/devices/devices using template in IoTDB | quantity{name="timeSeries",type="normal"} 1.0 |
| points | sg="", type="flush" | core | The point number of last flushed memtable | quantity{name="memtable",type="flush"} 1.0 |
1.3.3.6. Cluster
| Metric | Tag | level | Description | Sample |
|---|---|---|---|---|
| cluster_node_leader_count | name="" | important | The count of dataGroupLeader on each node, which reflects the distribution of leaders | cluster_node_leader_count{name="127.0.0.1",} 2.0 |
| cluster_uncommitted_log | name="" | important | The count of uncommitted_log on each node in data groups it belongs to | cluster_uncommitted_log{name="127.0.0.1_Data-127.0.0.1-40010-raftId-0",} 0.0 |
| cluster_node_status | name="" | important | The current node status, 1=online 2=offline | cluster_node_status{name="127.0.0.1",} 1.0 |
| cluster_elect_total | name="",status="fail/win" | important | The count and result (won or failed) of elections the node participated in. | cluster_elect_total{name="127.0.0.1",status="win",} 1.0 |
1.3.4. IoTDB PreDefined Metrics Set
Users can modify the value of predefinedMetrics in the iotdb-metric.yml file to enable the predefined set of metrics,now support JVM, LOGBACK, FILE, PROCESS, SYSYTEM.
1.3.4.1. JVM
1.3.4.1.1. Threads
| Metric | Tag | level | Description | Sample |
|---|---|---|---|---|
| jvm_threads_live_threads | None | Important | The current count of threads | jvm_threads_live_threads 25.0 |
| jvm_threads_daemon_threads | None | Important | The current count of daemon threads | jvm_threads_daemon_threads 12.0 |
| jvm_threads_peak_threads | None | Important | The max count of threads till now | jvm_threads_peak_threads 28.0 |
| jvm_threads_states_threads | state="runnable/blocked/waiting/timed-waiting/new/terminated" | Important | The count of threads in each status | jvm_threads_states_threads{state="runnable",} 10.0 |
1.3.4.1.2. GC
| Metric | Tag | level | Description | Sample |
|---|---|---|---|---|
| jvm_gc_pause_seconds_count | action="end of major GC/end of minor GC",cause="xxxx" | Important | The total count of YGC/FGC events and its cause | jvm_gc_pause_seconds_count{action="end of major GC",cause="Metadata GC Threshold",} 1.0 |
| jvm_gc_pause_seconds_sum | action="end of major GC/end of minor GC",cause="xxxx" | Important | The total cost seconds of YGC/FGC and its cause | jvm_gc_pause_seconds_sum{action="end of major GC",cause="Metadata GC Threshold",} 0.03 |
| jvm_gc_pause_seconds_max | action="end of major GC",cause="Metadata GC Threshold" | Important | The max cost seconds of YGC/FGC till now and its cause | jvm_gc_pause_seconds_max{action="end of major GC",cause="Metadata GC Threshold",} 0.0 |
| jvm_gc_memory_promoted_bytes_total | None | Important | Count of positive increases in the size of the old generation memory pool before GC to after GC | jvm_gc_memory_promoted_bytes_total 8425512.0 |
| jvm_gc_max_data_size_bytes | None | Important | Max size of long-lived heap memory pool | jvm_gc_max_data_size_bytes 2.863661056E9 |
| jvm_gc_live_data_size_bytes | None | Important | Size of long-lived heap memory pool after reclamation | jvm_gc_live_data_size_bytes 8450088.0 |
| jvm_gc_memory_allocated_bytes_total | None | Important | Incremented for an increase in the size of the (young) heap memory pool after one GC to before the next | jvm_gc_memory_allocated_bytes_total 4.2979144E7 |
1.3.4.1.3. Memory
| Metric | Tag | level | Description | Sample |
|---|---|---|---|---|
| jvm_buffer_memory_used_bytes | id="direct/mapped" | Important | An estimate of the memory that the Java virtual machine is using for this buffer pool | jvm_buffer_memory_used_bytes{id="direct",} 3.46728099E8 |
| jvm_buffer_total_capacity_bytes | id="direct/mapped" | Important | An estimate of the total capacity of the buffers in this pool | jvm_buffer_total_capacity_bytes{id="mapped",} 0.0 |
| jvm_buffer_count_buffers | id="direct/mapped" | Important | An estimate of the number of buffers in the pool | jvm_buffer_count_buffers{id="direct",} 183.0 |
| jvm_memory_committed_bytes | {area="heap/nonheap",id="xxx",} | Important | The amount of memory in bytes that is committed for the Java virtual machine to use | jvm_memory_committed_bytes{area="heap",id="Par Survivor Space",} 2.44252672E8 jvm_memory_committed_bytes{area="nonheap",id="Metaspace",} 3.9051264E7 |
| jvm_memory_max_bytes | {area="heap/nonheap",id="xxx",} | Important | The maximum amount of memory in bytes that can be used for memory management | jvm_memory_max_bytes{area="heap",id="Par Survivor Space",} 2.44252672E8 jvm_memory_max_bytes{area="nonheap",id="Compressed Class Space",} 1.073741824E9 |
| jvm_memory_used_bytes | {area="heap/nonheap",id="xxx",} | Important | The amount of used memory | jvm_memory_used_bytes{area="heap",id="Par Eden Space",} 1.000128376E9 jvm_memory_used_bytes{area="nonheap",id="Code Cache",} 2.9783808E7 |
1.3.4.1.4. Classes
| Metric | Tag | level | Description | Sample |
|---|---|---|---|---|
| jvm_classes_unloaded_classes_total | None | Important | The total number of classes unloaded since the Java virtual machine has started execution | jvm_classes_unloaded_classes_total 680.0 |
| jvm_classes_loaded_classes | None | Important | The number of classes that are currently loaded in the Java virtual machine | jvm_classes_loaded_classes 5975.0 |
| jvm_compilation_time_ms_total | {compiler="HotSpot 64-Bit Tiered Compilers",} | Important | The approximate accumulated elapsed time spent in compilation | jvm_compilation_time_ms_total{compiler="HotSpot 64-Bit Tiered Compilers",} 107092.0 |
1.3.4.2. File
| Metric | Tag | level | Description | Sample |
|---|---|---|---|---|
| file_size | name="wal/seq/unseq" | important | The current file size of wal/seq/unseq in bytes | file_size{name="wal",} 67.0 |
| file_count | name="wal/seq/unseq" | important | The current count of wal/seq/unseq files | file_count{name="seq",} 1.0 |
1.3.4.3. Logback
| Metric | Tag | level | Description | 示例 |
|---|---|---|---|---|
| logback_events_total | {level="trace/debug/info/warn/error",} | Important | The count of trace/debug/info/warn/error log events till now | logback_events_total{level="warn",} 0.0 |
1.3.4.4. Process
| Metric | Tag | level | Description | 示例 |
|---|---|---|---|---|
| process_cpu_load | name="cpu" | core | current process CPU Usage (%) | process_cpu_load{name="process",} 5.0 |
| process_cpu_time | name="cpu" | core | total Process CPU Time Occupied (ns) | process_cpu_time{name="process",} 3.265625E9 |
| process_max_mem | name="memory" | core | The maximum available memory for the JVM | process_max_mem{name="process",} 3.545759744E9 |
| process_used_mem | name="memory" | core | The current available memory for the JVM | process_used_mem{name="process",} 4.6065456E7 |
| process_total_mem | name="memory" | core | The current requested memory for the JVM | process_total_mem{name="process",} 2.39599616E8 |
| process_free_mem | name="memory" | core | The free available memory for the JVM | process_free_mem{name="process",} 1.94035584E8 |
| process_mem_ratio | name="memory" | core | Memory footprint ratio of process | process_mem_ratio{name="process",} 0.0 |
| process_threads_count | name="process" | core | The current number of threads | process_threads_count{name="process",} 11.0 |
| process_status | name="process" | core | The process survivor status, 1.0 means survivorship, and 0.0 means terminated | process_status{name="process",} 1.0 |
1.3.4.5. System
| Metric | Tag | level | Description | 示例 |
|---|---|---|---|---|
| sys_cpu_load | name="cpu" | core | current system CPU Usage(%) | sys_cpu_load{name="system",} 15.0 |
| sys_cpu_cores | name="cpu" | core | available CPU cores | sys_cpu_cores{name="system",} 16.0 |
| sys_total_physical_memory_size | name="memory" | core | Maximum physical memory of system | sys_total_physical_memory_size{name="system",} 1.5950999552E10 |
| sys_free_physical_memory_size | name="memory" | core | The current available memory of system | sys_free_physical_memory_size{name="system",} 4.532396032E9 |
| sys_total_swap_space_size | name="memory" | core | The maximum swap area of system | sys_total_swap_space_size{name="system",} 2.1051273216E10 |
| sys_free_swap_space_size | name="memory" | core | The available swap area of system | sys_free_swap_space_size{name="system",} 2.931576832E9 |
| sys_committed_vm_size | name="memory" | important | the amount of virtual memory available to running processes | sys_committed_vm_size{name="system",} 5.04344576E8 |
| sys_disk_total_space | name="disk" | core | The total disk space | sys_disk_total_space{name="system",} 5.10770798592E11 |
| sys_disk_free_space | name="disk" | core | The available disk space | sys_disk_free_space{name="system",} 3.63467845632E11 |
1.3.5. Add custom metrics
- If you want to add your own metrics data in IoTDB, please see the [IoTDB Metric Framework] (https://github.com/apache/iotdb/tree/master/metrics) document.
- Metric embedded point definition rules
Metric: The name of the monitoring item. For example,entry_seconds_countis the cumulative number of accesses to the interface, andfile_sizeis the total number of files.Tags: Key-Value pair, used to identify monitored items, optionalname = xxx: The name of the monitored item. For example, for the monitoring itementry_seconds_count, the meaning of name is the name of the monitored interface.status = xxx: The status of the monitored item is subdivided. For example, the monitoring item of the monitoring task can use this parameter to separate the running task and the stopped task.user = xxx: The monitored item is related to a specific user, such as the total number of writes by the root user.- Customize for the situation...
- Monitoring indicator level meaning:
- The default startup level for online operation is
Importantlevel, the default startup level for offline debugging isNormallevel, and the audit strictness isCore > Important > Normal > All Core: The core indicator of the system, used by the operation and maintenance personnel, which is related to the performance, stability, and security** of the system, such as the status of the instance, the load of the system, etc.Important: An important indicator of the module, which is used by operation and maintenance and testers, and is directly related to the running status of each module, such as the number of merged files, execution status, etc.Normal: General indicators of the module, used by developers to facilitate locating the module when problems occur, such as specific key operation situations in the merger.All: All indicators of the module, used by module developers, often used when the problem is reproduced, so as to solve the problem quickly.
- The default startup level for online operation is
1.4. How to get these metrics?
The metrics collection switch is disabled by default,you need to enable it from conf/iotdb-metric.yml, Currently, it also supports hot loading via load configuration after startup.
1.4.1. Iotdb-metric.yml
# whether enable the module
enableMetric: false

# Is stat performance of operation latency
enablePerformanceStat: false

# Multiple reporter, options: [JMX, PROMETHEUS, IOTDB], IOTDB is off by default
metricReporterList:
  - JMX
  - PROMETHEUS

# Type of monitor frame, options: [MICROMETER, DROPWIZARD]
monitorType: MICROMETER

# Level of metric level, options: [CORE, IMPORTANT, NORMAL, ALL]
metricLevel: IMPORTANT

# Predefined metric, options: [JVM, LOGBACK, FILE, PROCESS, SYSTEM]
predefinedMetrics:
  - JVM
  - FILE

# The http server's port for prometheus exporter to get metric data.
prometheusExporterPort: 9091

# whether store predefined metrics locally
isStoreToLocal: false

# The config of iotdb reporter
ioTDBReporterConfig:
  host: 127.0.0.1
  port: 6667
  username: root
  password: root
  database: _metric
  pushPeriodInSecond: 15
Then you can get metrics data as follows
- Enable metrics switch in
iotdb-metric.yml - You can just stay other config params as default.
- Start/Restart your IoTDB server/cluster
- Open your browser or use the
curlcommand to requesthttp://servier_ip:9091/metrics,then you will get metrics data like follows:
...
# HELP file_count
# TYPE file_count gauge
file_count{name="wal",} 0.0
file_count{name="unseq",} 0.0
file_count{name="seq",} 2.0
# HELP file_size
# TYPE file_size gauge
file_size{name="wal",} 0.0
file_size{name="unseq",} 0.0
file_size{name="seq",} 560.0
# HELP queue
# TYPE queue gauge
queue{name="flush",status="waiting",} 0.0
queue{name="flush",status="running",} 0.0
# HELP quantity
# TYPE quantity gauge
quantity{name="timeSeries",} 1.0
quantity{name="storageGroup",} 1.0
quantity{name="device",} 1.0
# HELP logback_events_total Number of error level events that made it to the logs
# TYPE logback_events_total counter
logback_events_total{level="warn",} 0.0
logback_events_total{level="debug",} 2760.0
logback_events_total{level="error",} 0.0
logback_events_total{level="trace",} 0.0
logback_events_total{level="info",} 71.0
# HELP mem
# TYPE mem gauge
mem{name="storageGroup",} 0.0
mem{name="mtree",} 1328.0
...
1.4.2. Integrating with Prometheus and Grafana
As above descriptions,IoTDB provides metrics data in standard Prometheus format,so we can integrate with Prometheus and Grafana directly.
The following picture describes the relationships among IoTDB, Prometheus and Grafana

- Along with running, IoTDB will collect its metrics continuously.
- Prometheus scrapes metrics from IoTDB at a constant interval (can be configured).
- Prometheus saves these metrics to its inner TSDB.
- Grafana queries metrics from Prometheus at a constant interval (can be configured) and then presents them on the graph.
So, we need to do some additional works to configure and deploy Prometheus and Grafana.
For instance, you can config your Prometheus as follows to get metrics data from IoTDB:
job_name: pull-metrics
honor_labels: true
honor_timestamps: true
scrape_interval: 15s
scrape_timeout: 10s
metrics_path: /metrics
scheme: http
follow_redirects: true
static_configs:
- targets:
  - localhost:9091
The following documents may help you have a good journey with Prometheus and Grafana.
Grafana query metrics from Prometheus
1.4.3. Apache IoTDB Dashboard
We provide the Apache IoTDB Dashboard, and the rendering shown in Grafana is as follows:

How to get Apache IoTDB Dashboard:
Method one: You can obtain the json files of Dashboards corresponding to different iotdb versions in the grafana-metrics-example folder.
Method two: You can visit Grafana Dashboard official website, click here to download Apache IoTDB Dashboard.
When creating Grafana, you can select the json file you just downloaded to Import and select the corresponding target data source for Apache IoTDB Dashboard.
2. System Status Monitoring
After starting JConsole tool and connecting to IoTDB server, a basic look at IoTDB system status(CPU Occupation, in-memory information, etc.) is provided. See official documentation for more information.
3. JMX MBean Monitoring
By using JConsole tool and connecting with JMX you are provided with some system statistics and parameters.
This section describes how to use the JConsole Mbeantab of jconsole to monitor some system configurations of IoTDB, the statistics of writing, and so on. After connecting to JMX, you can find the "MBean" of "org.apache.iotdb.service", as shown in the figure below.
4. Performance Monitor
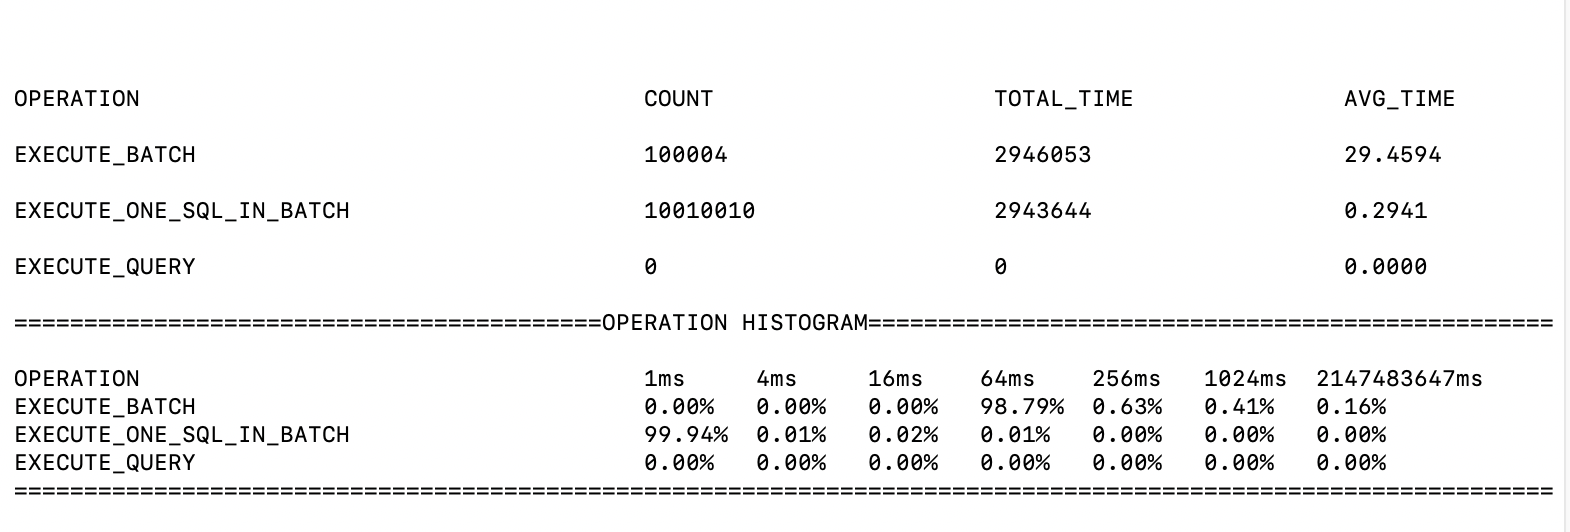
4.1. Introduction
To grasp the performance of iotdb, this module is added to count the time-consumption of each operation. This module can compute the statistics of the avg time-consuming of each operation and the proportion of each operation whose time consumption falls into a time range. The output is in log_measure.log file. An output example is below.
4.2. Configuration parameter
location:conf/iotdb-datanode.properties
Table -parameter and description
| Parameter | Default Value | Description |
|---|---|---|
| enable_performance_stat | false | Is stat performance of sub-module enable. |
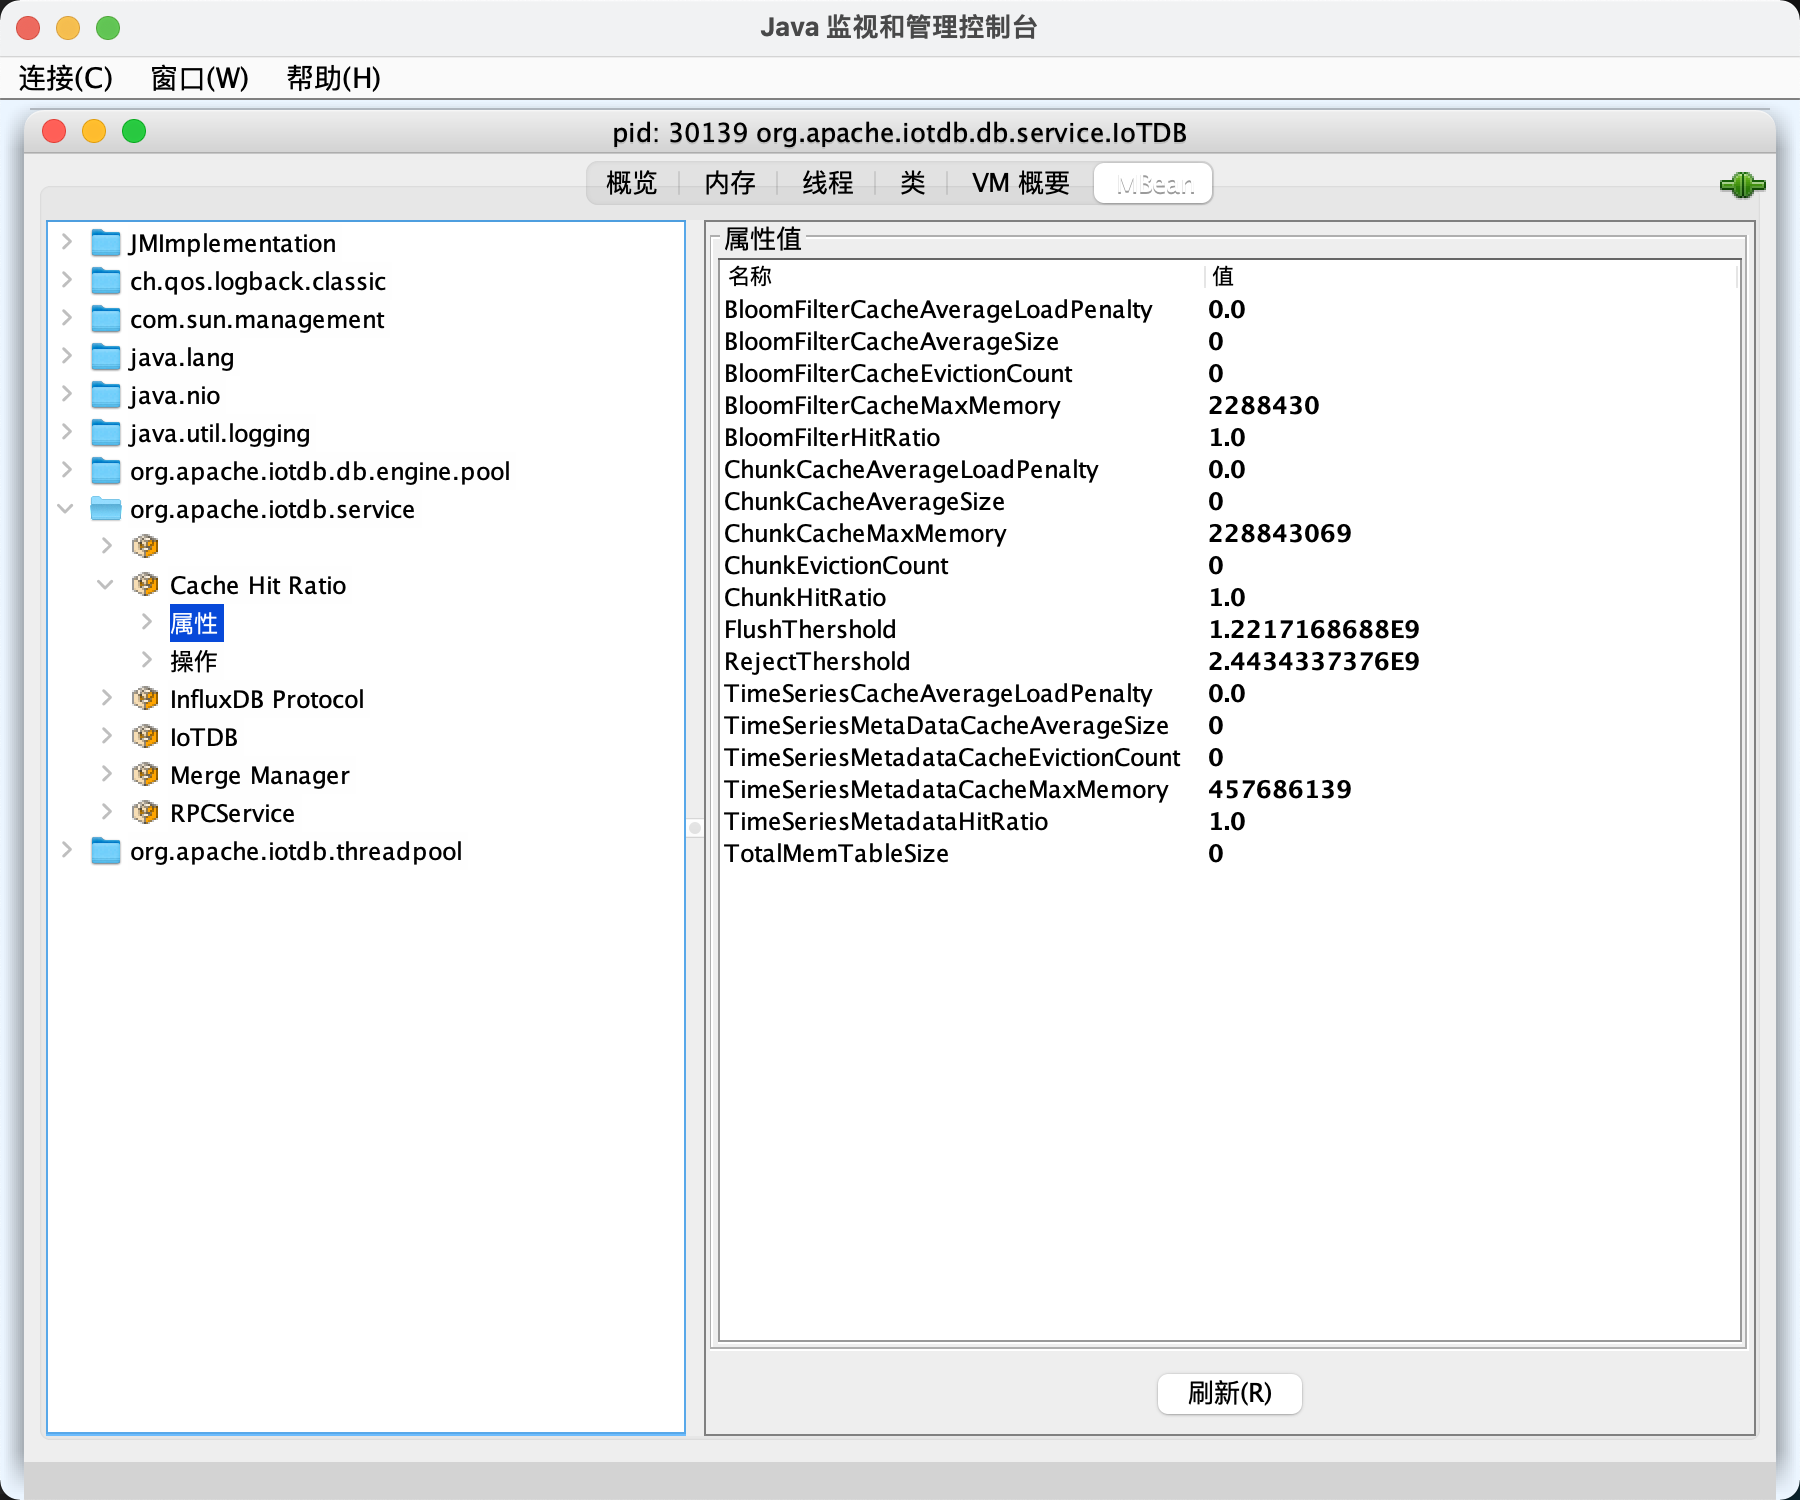
5. Cache Hit Ratio Statistics
To improve query performance, IOTDB caches ChunkMetaData and TsFileMetaData. Users can view the cache hit ratio through debug level log and MXBean, and adjust the memory occupied by the cache according to the cache hit ratio and system memory. The method of using MXBean to view cache hit ratio is as follows:
- Connect to jconsole with port 31999 and select 'MBean' in the menu item above.
- Expand the sidebar and select 'org.apache.iotdb.db.service'. You will get the results shown in the following figure:
